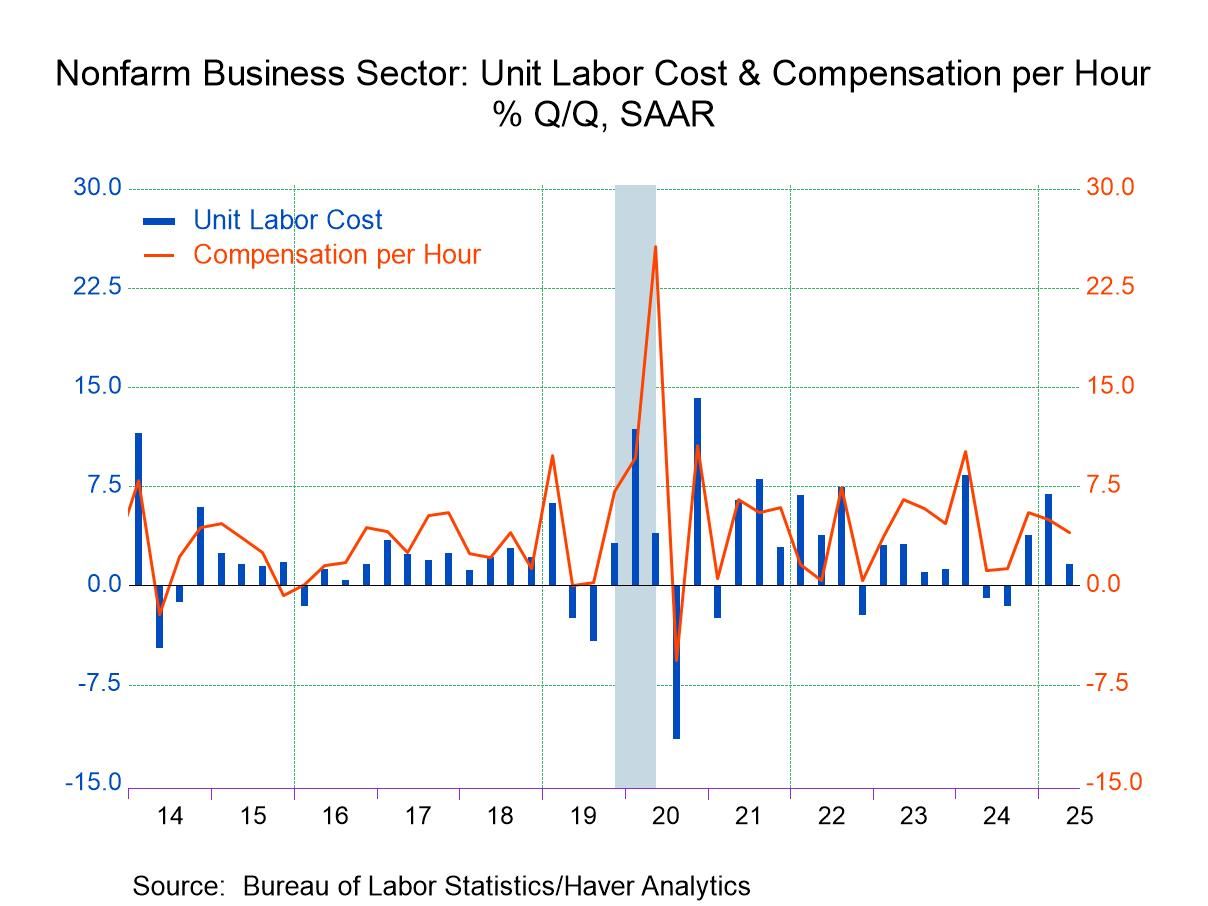
- Nonfarm business productivity increased 2.4% q/q annualized in Q2, more than reversing the 1.8% quarterly decline in Q1.
- Compensation growth slowed to 4.0% from 5.0% in Q1.
- Consequently, unit labor cost growth slowed markedly to 1.6% from 6.9% in Q1.
- USA| Aug 07 2025
U.S. Productivity Rebounded in Q2; Unit Labor Costs Slowed
by:Sandy Batten
|in:Economy in Brief
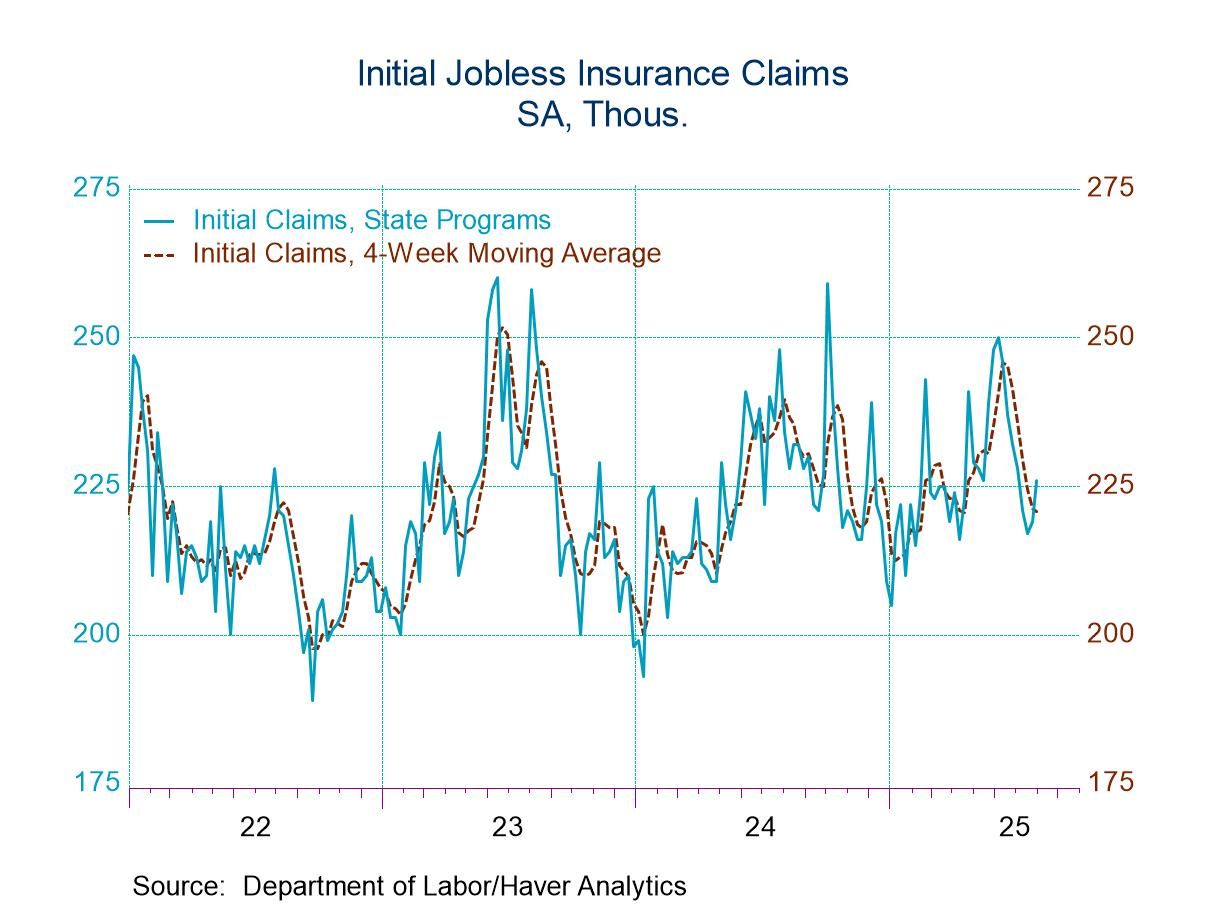
- Initial claims increase to highest in four weeks.
- Continuing claims continue upward trend.
- Insured unemployment rate holds steady.
by:Tom Moeller
|in:Economy in Brief
- Germany| Aug 07 2025
Downdraft for German IP
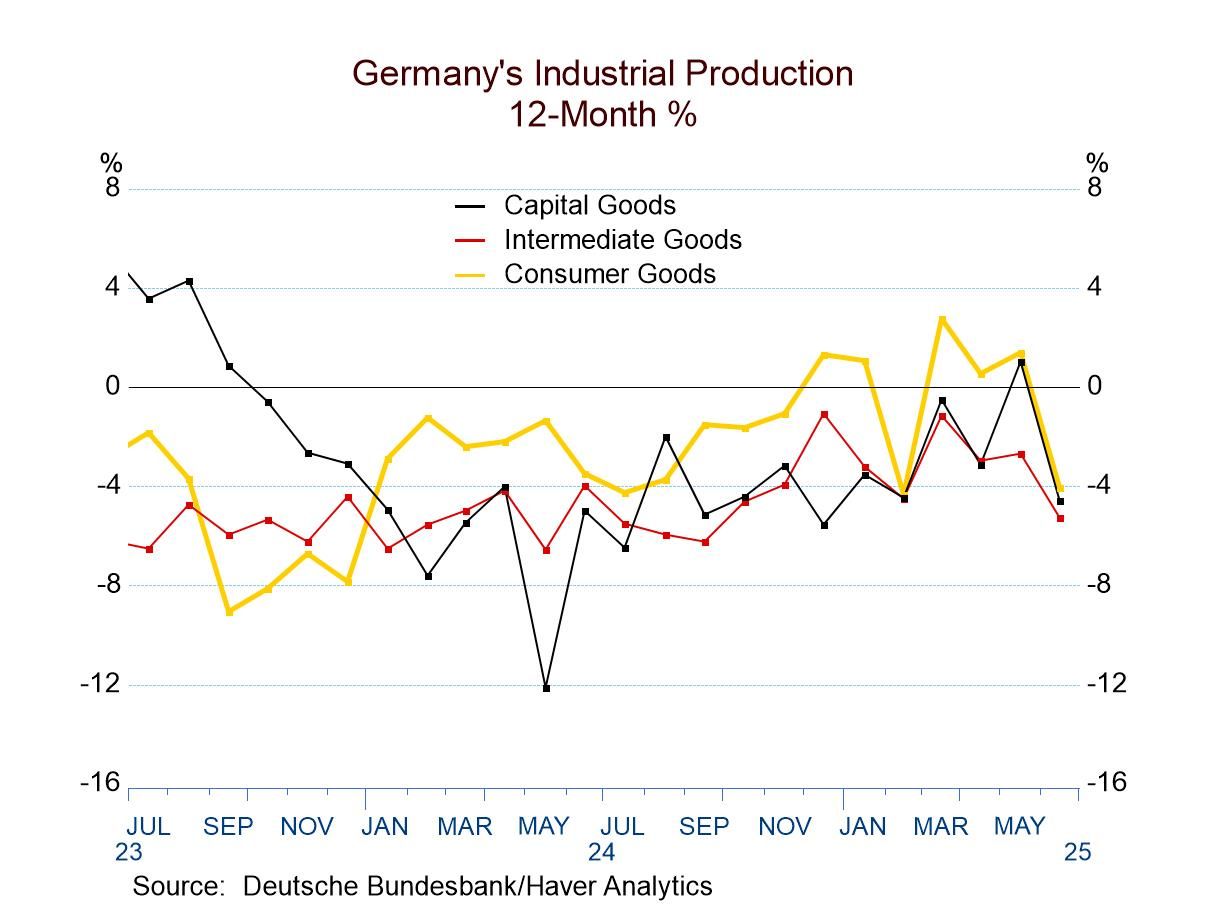
Industrial production in Germany fell by 1.9% in June and continues to show weak performance on trend. Yesterday's report on German industrial orders was weak. The table below on German industrial production shows the orders results presented with other output data and industrial surveys for Germany and some other key European economies that report manufacturing and industrial data early.
Today's industrial report shows a 1.9% decline in German industrial production in June after slipping 0.1% in May and falling by 1.6% in April. The three-month annual rate change in industrial production is a decline of 13.4% at an annual rate; that stepped up from a 1.8% annual rate decline over six months and from a 3.5% annual rate decline over 12 months.
Broad sector-wide manufacturing weakness Consumer goods output fell an outsized 5.6% in June. The sequential annualized growth rate for consumer goods is -4% over 12 months, -6.3% over six months and -22.7% over three months - an accelerating pace of decline. Capital goods output fell by 3.2% in June. Its sequential pattern is not as clear a decelerating pattern as for consumer goods, but it's substantially indicative of the same trend with a 4.6% decline over 12 months, an annual rate decline of 2.2% over six months and then a stepped-up decline of 19% at an annual rate over three months. Intermediate goods output fell by only 0.6% in June, but it has a string of negative values coming into June. Its sequential growth rates show a drop of 5.3% over 12 months, a drop at a 1.2% annual rate over six months, and then an outsized drop of 16% at an annual rate over three months. The profile for German industrial production is extremely weak, broad, and disappointing.
Construction weakness as well Construction output rose by 1.3% in June; however, it's coming off of declines in both May and April and its sequential growth rates become progressively weaker from 12-months to 6-months to 3-months, culminating in a -9.9% annual rate decline over the last three months.
Industrial surveys are more upbeat Surveys of industrial conditions in Germany are actually more positive than the orders data from yesterday or the industrial production data in today's report. The ZEW current reading shows an improvement from May to June as well as from April to June. The IFO manufacturing survey shows no change in the index in June compared to May, but it's stepped up compared to April. IFO manufacturing expectations show improvements in a sequence, from April to May to June. The EU Commission industrial survey shows deterioration in June compared to May and also in June compared to April- it is the survey ‘outlier.’ The sequential survey averages over 12 months, six months, and three months for all four surveys show improved readings over three months compared to the respective 12-month averages. The survey data are more encouraging than either the output or the orders data.
Other European trends Manufacturing trends for other early reporting European countries, France, Spain, Portugal, and Norway, show largely better performance in June for these countries compared to the German results. Portugal's June report is an exception; a 3.6% decline in output in June is large. However, over three months, all four of these European countries have better performance than Germany. Portugal still logs in decline in output but a decline of only 0.4%, much better than the numbers reported by Germany over three months. In each of these countries France, Spain, Portugal, and Norway, there were increases in output over 12 months ranging from 2.4% in France to 4.1% in Norway, as German output fell by 3.5%.
Quarter to date (Q2-results) Quarter-to-date (QTD) IP shows declines for all these German measures; the sole increase among the German indicators is for real manufacturing orders. Surveys for Germany on a QTD basis show positive changes compared to the previous quarter. The other European countries show strength, a 15.9% rise in output in France, a gain of 1.6% at an annual rate in Spain, a smaller 1.3% annual rate decline in Norway, against a sharp 10% annual rate reduction in output in Portugal for the quarter to date.
Ranked performance of growth rates and surveys The second column from the right memorializes the queue (or ranked) standings of current readings over a 25-year span. The result of this exercise is to find German orders, output, real sales, and all of the surveys with the rankings below their 50-percentile mark, putting them all below their medians for the last 25 years. This is in sharp contrast to ‘other Europe’ where France, Spain, Portugal, and Norway all have rank standings at about the 75th percentile or higher when we compare growth rates over the last year to what they have done over the last 25 years. Clearly Germany is lagging badly.
- USA| Aug 06 2025
U.S. Mortgage Applications Rise Last Week as Interest Rates Slip
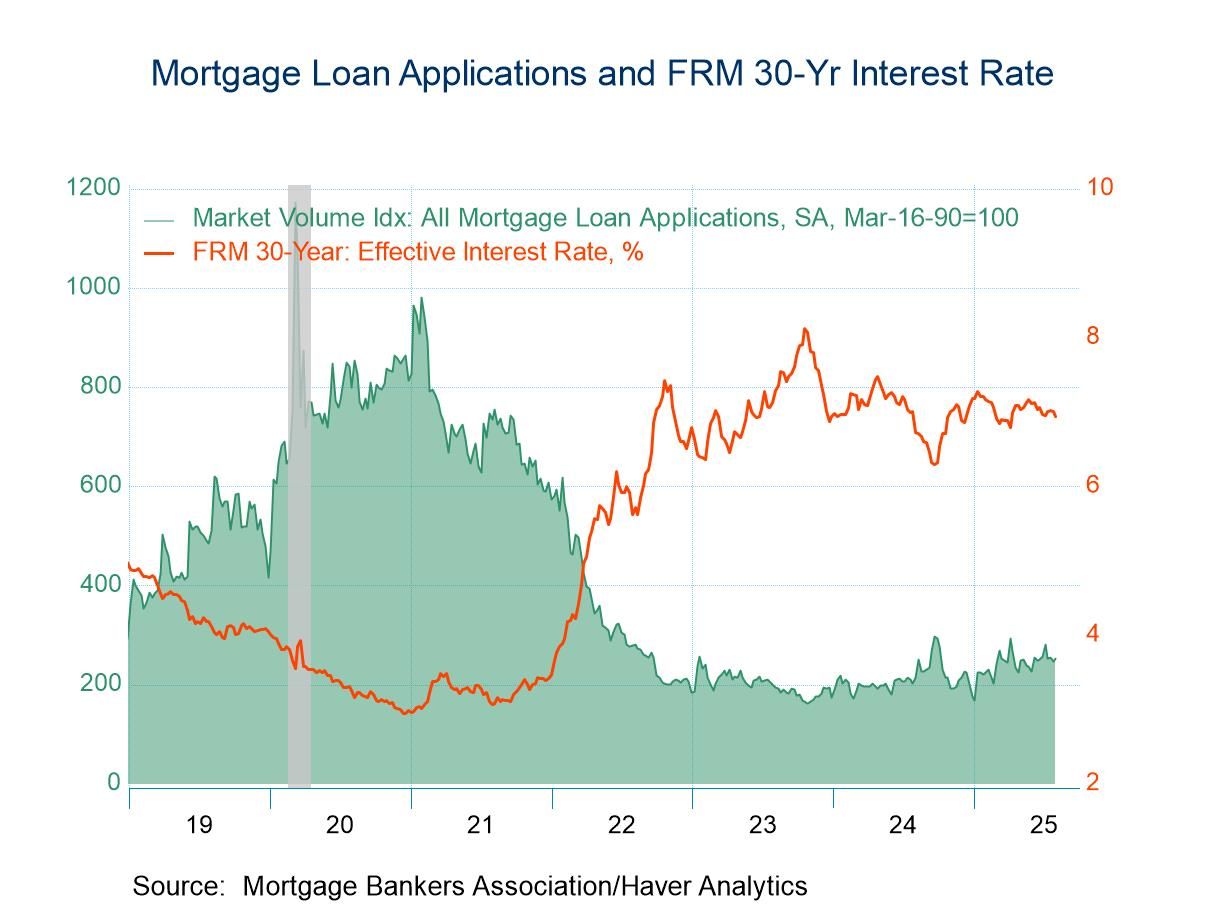
- Loan refinancing jumps as purchase applications edge higher.
- Effective fixed-interest rate eases on 30-year loans.
- Average loan size increases again.
by:Tom Moeller
|in:Economy in Brief
- Germany| Aug 06 2025
German Orders Fall Again, Unexpectedly
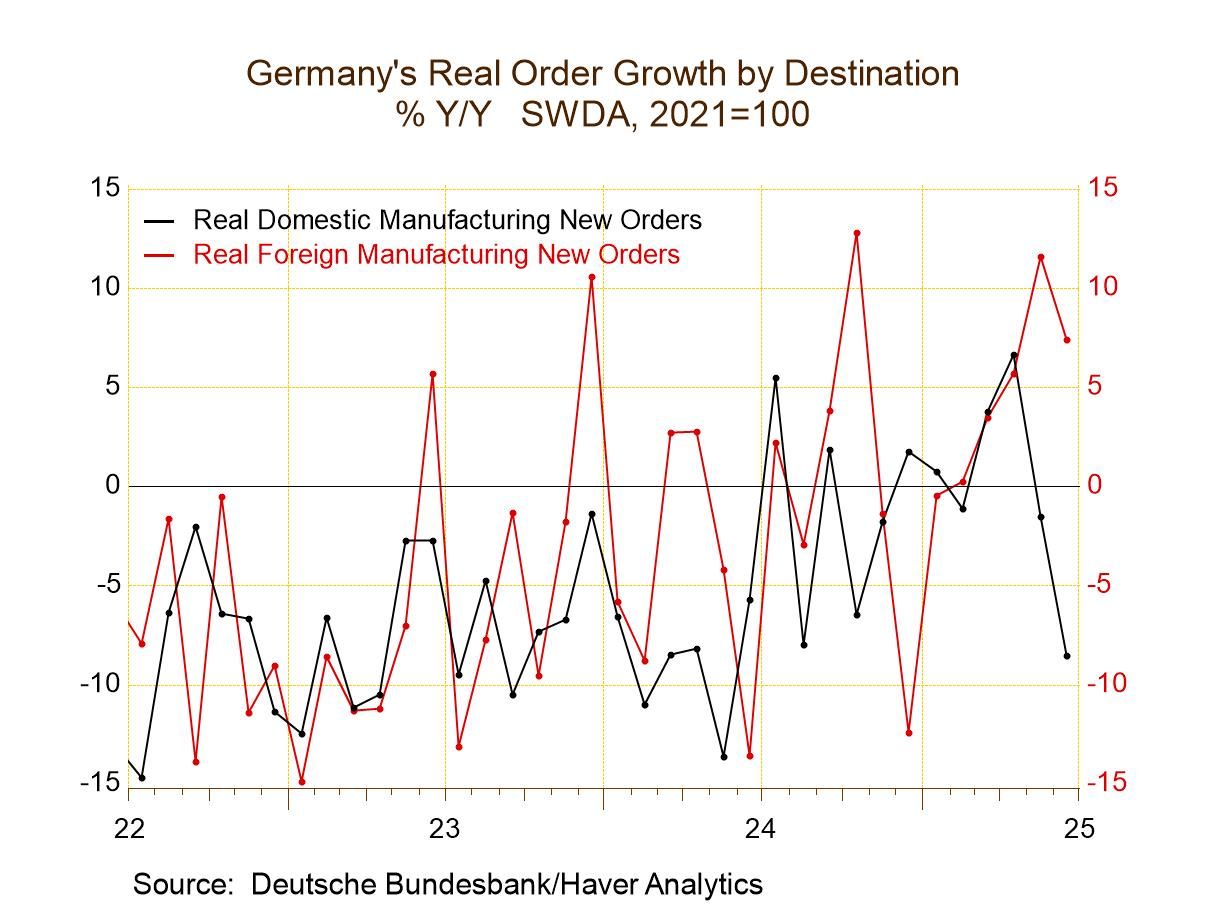
German orders expressed in real terms fell by 1% in June after falling by 0.8% in May. Foreign orders fell by 3% month-to-month after rising 3.8% in May. Domestic orders came back to life rising by 2.2% in June but only after a sharp 7.5% drop in May; that drop had been preceded by a 2.8% increase in April. The gyration and trend performance of orders is still choppy and, for the most part, weak.
Order trends Sequential growth rates show that overall orders for Germany (still expressed in real terms) rose by 0.6% over 12 months; however, they fall at 4.7% annual rate over six months and fall at a 0.5% annual rate over three months. Foreign orders rise by 7.4% over 12 months; over six months the gain is at a 13.7% annual rate, and over three months that pace is reduced to a 7.3% annual rate. German domestic orders fall by 8.6% over 12 months, then decline at an extremely rapid 26.1% annual rate over six months, and continue to decline at 11.1% annual rate over three months. For the time being, orders have been propped up by strength in the international market while domestic orders continue to languish and to contract.
Real sales Sector sales, expressed in real terms, rose by 1% and those across all the components after seeing widespread contractions in May that had followed an uneven performance in April. Real sales for manufacturing fall by 1.5% over 12 months, fall at a 1.9% annual rate over six months, and fall at an annual rate of 9.2% over three months. Real sales trends are not reassuring.
European Surveys on Industry Survey results for the largest economies in the European Monetary Union show slippages in June compared to May as three of the four large economies weaken (with Italy being the exception). Over three months France logged a weaker reading compared to six-months, Germany improved, Italy's performance is unchanged; Spain reports a result that's better by a single tick on the survey index comparing 3-months to 6-months. Comparing the 12-month to averages to 3-month averages for the four large European economies, shows deterioration that's across the board with the slight exception of Italy.
Quarter-to-date (completed Q2) The quarter-to-date (QTD) performance in Germany for orders are strong, rising at a 13.1% annual rate. Sector sales show deteriorated real sector sales across most sectors on QTD basis; manufacturing sales fall at a 2.9% annual rate.
Longer term evaluations The two right hand columns evaluate the growth and level performance of these various metrics on real sector sales and on a level basis and well as on annual growth rates. Total orders and foreign orders ranked on levels are well above their 50% mark, which puts them above their median on data back to 1994. Domestic sales levels have only a 21.8 percentile standing, extremely weak. Rankings on growth rates show total orders at a 45.9 percentile ranking, below the median growth rate (which occurs at a ranking of 50%). However, foreign orders’ growth ranks in the 70th percentile, quite firm, while the domestic growth rate queue ranking resides in the lower 10.7 percentile of its range. Growth rates for real sector sales are mostly below their 50-percentile mark except for consumer nondurables and consumer goods sales overall (which, of course, are boosted by the sales of consumer nondurables). The industrial confidence indicators for European economies that are from diffusion surveys are evaluated relative to historic levels only. All of them score weak results. The best queue standing is Spain with a 37.5 percentile standing, followed by Italy at a 24.8 percentile standing. France has a 14.6 percentile standing, while Germany has a 7.4 percentile standing. These range from weak, and below median, to very weak.
- USA| Aug 05 2025
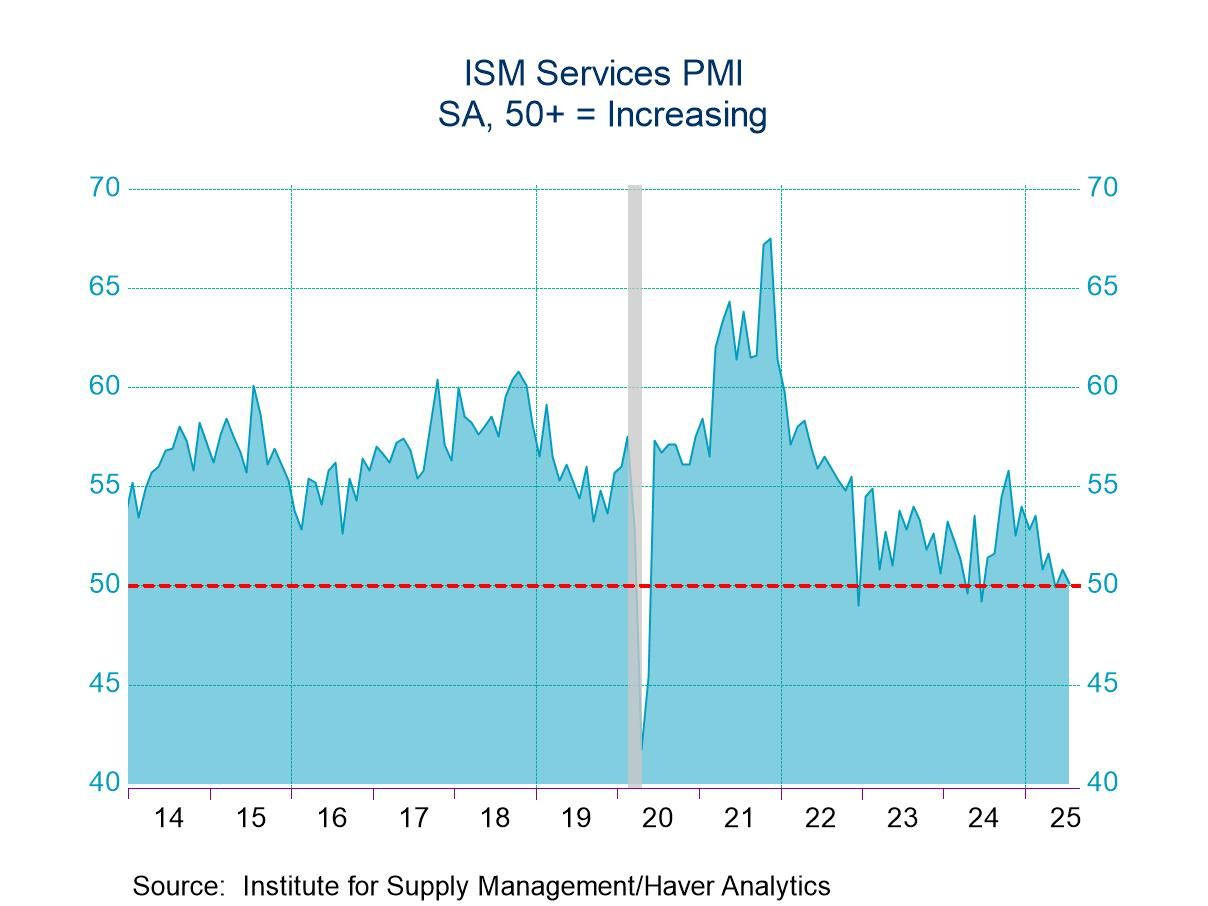
U.S. ISM Services PMI Declines in July; Price Index Increases
- Total index trending lower for nine months.
- Business activity, new orders & employment weaken.
- Prices Index strengthens to highest level since 2022.
by:Tom Moeller
|in:Economy in Brief
- USA| Aug 05 2025
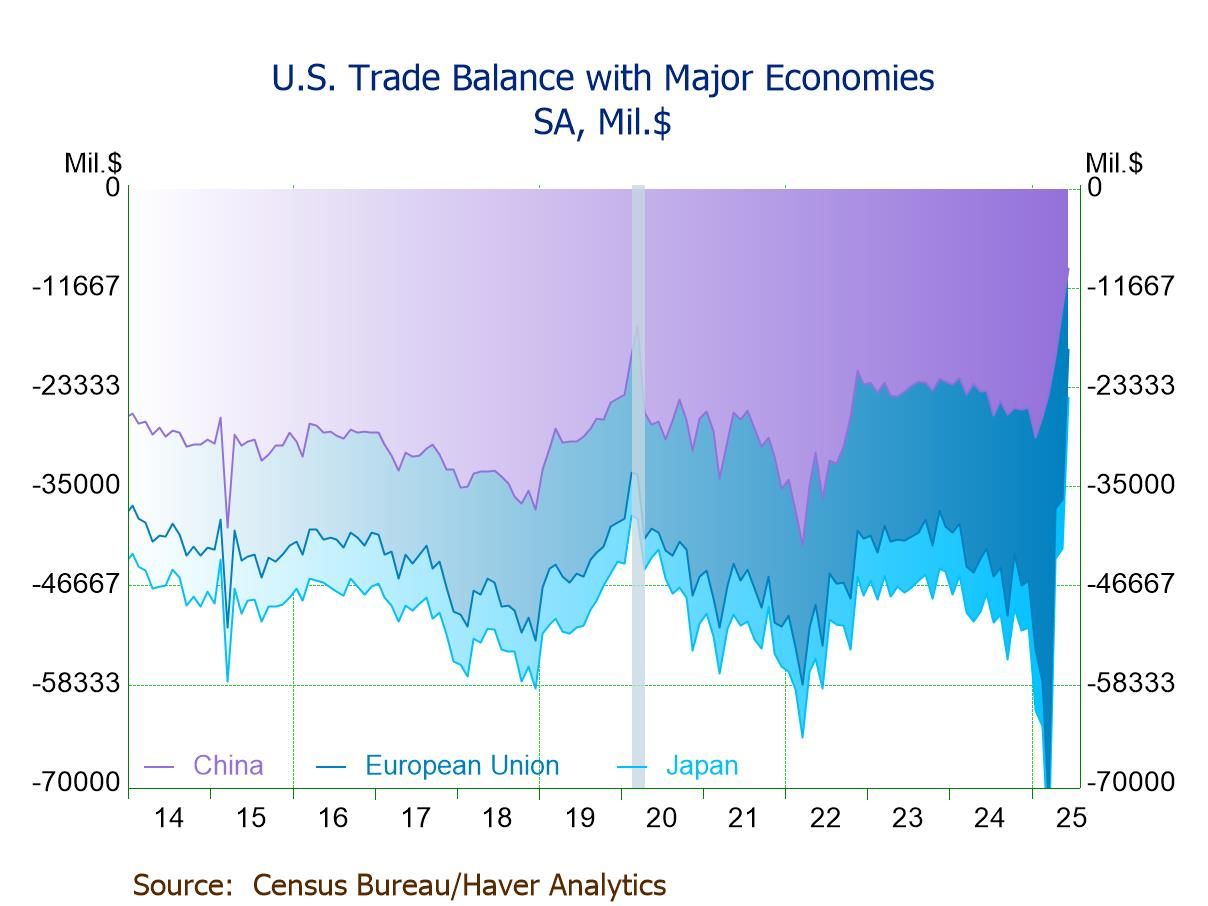
U.S. Trade Deficit Narrows in June; the Smallest Since Sept. ’23
- $60.2 bil. trade deficit, reflecting $85.9 bil. goods deficit & $25.7 bil. services surplus.
- Exports -0.5% m/m, down for the second consecutive month.
- Imports -3.7% m/m, down for the third straight month.
- Real goods trade deficit narrows to $84.6 bil. after May’s widening.
- Goods trade deficits w/ China at a record low, w/ EU at a June ’13 low, and w/ Japan at a 4-month low.
 Global| Aug 05 2025
Service Sectors Prop-up Global Economy
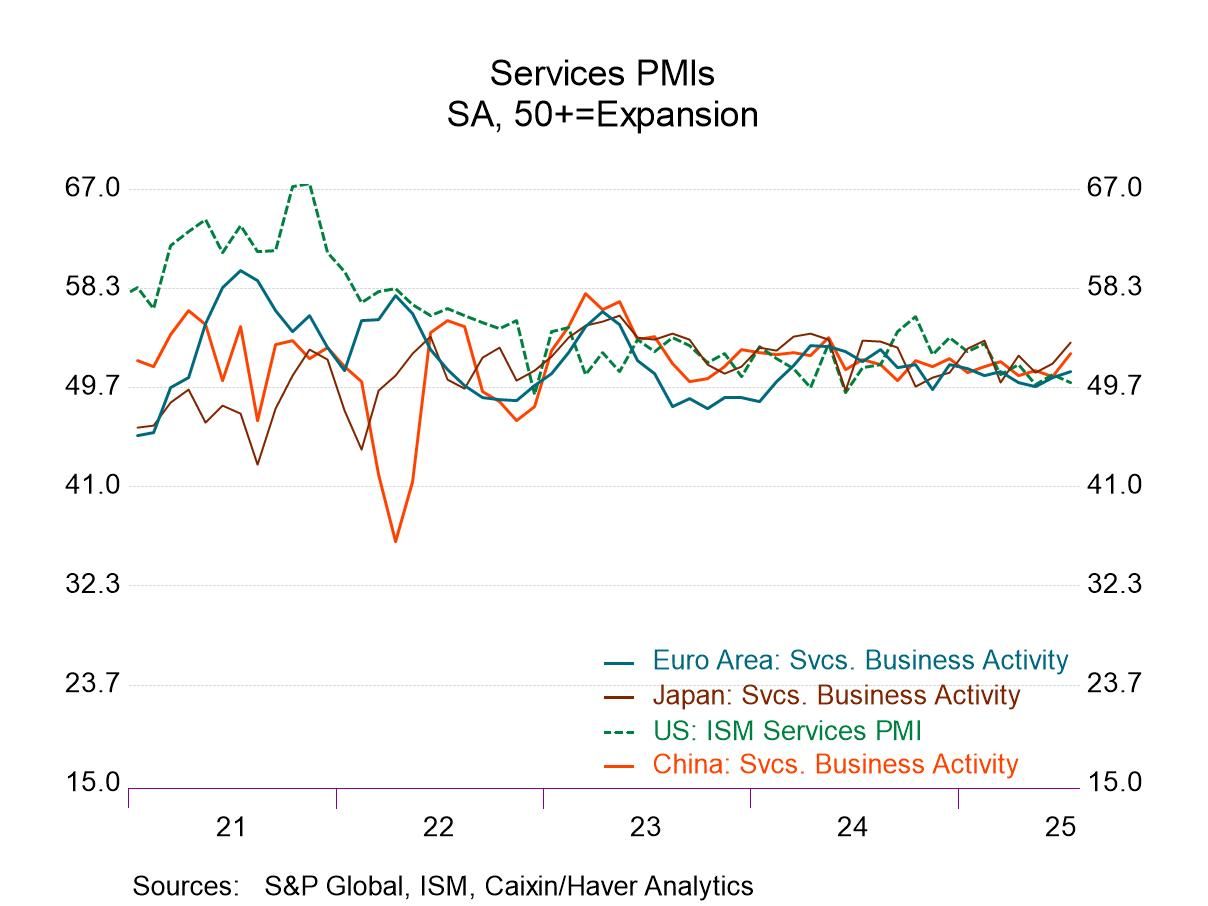
The S&P Global PMI indexes once again showed mixed performance in July. Most large economies continue to do better, and the total PMI services sectors continue to make up for shortcomings in manufacturing.
Stability on a low growth path In July, 24% of the reporting countries showed activity was slowing; that's down from 48% in both June and May and indicates some progress. Only five of the reporting jurisdictions have PMI values below 50 indicating economic contraction in July; that July figure compares to five in June and seven in May. Declining activity continues to be an unusual event. Medians and average readings for the group of 25 countries or regions show extreme stability in the recent months as well as across sequential averages.
Growth moderately improves Comparing period averages from 12-months to six-months to three-months, unweighted readings of the U.S., the U.K., and European monetary union show extremely flat PMI values oscillating between values of 51.2 to 51.7 on those period averages; over three months, six months, and 12 months. The jurisdictions in the table show PMI readings below 50 are rare; once again declining activity is an unusual event. The proportion of reporters slowing over three months is 34.8% compared to 52.2% over six months and 30.4% over 12 months. Once again, we see these statistics tilted toward improving growth rather than towards slowing
Summing up The queue percentile standings for the group in July have an average value at 48.4% which is below the 50% mark that coincides with the median for the period. This tells us the growth is largely worse than what its median has been over the past 4 1/2 years. On a queue ranking basis, the largest economies consistently perform better with readings above the 50% mark for the U.S. and for the European Monetary System including each of its four largest EMU economies (Germany, France, Italy, and Spain). Japan has a queue standing in its 57th percentile. However, China’s percentile standing is in its 26th percentile and the U.K. is at its 40.5 percentile. Not all large economies are in the catbird seat, but most are faring well despite the moderate growth track globally.
- of2693Go to 46 page


