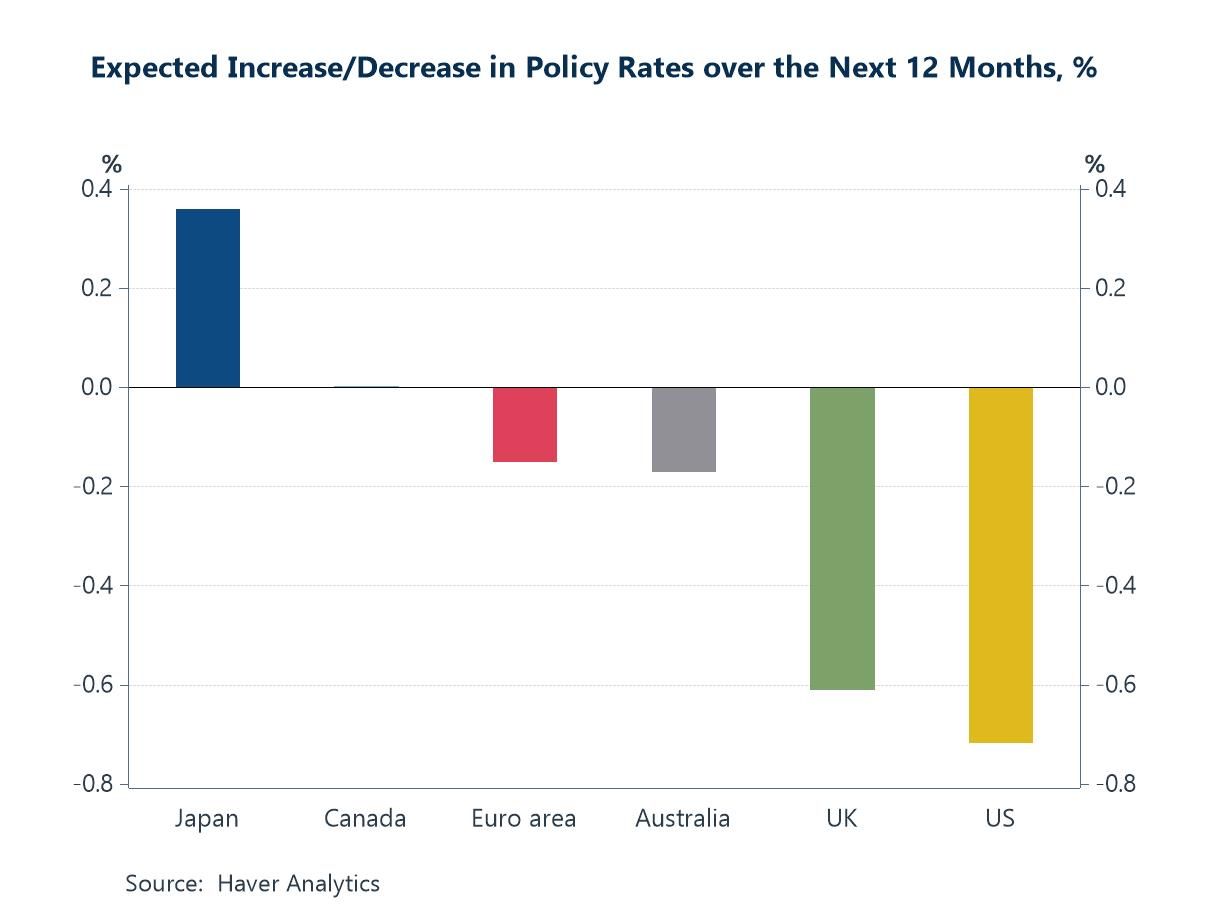
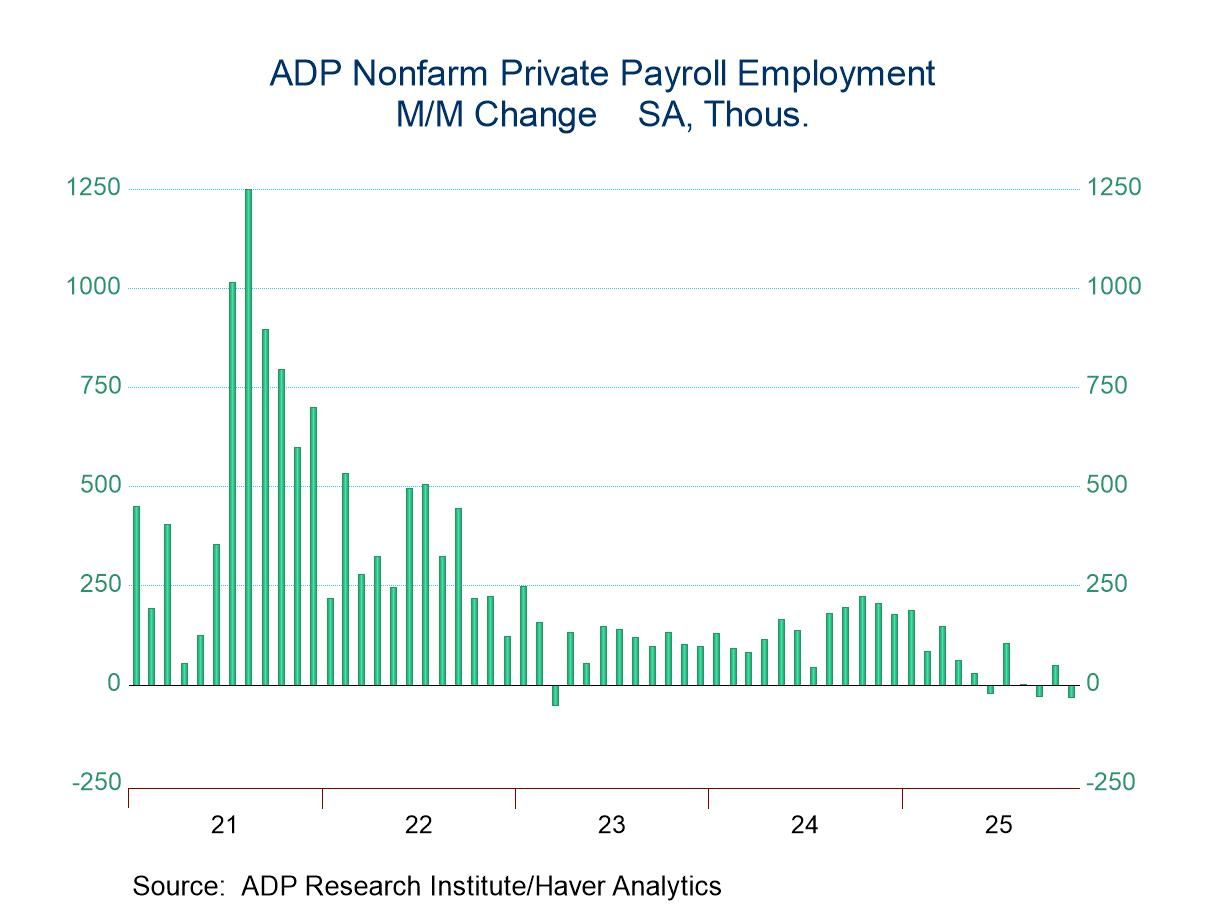
Global financial markets have been navigating a more unsettled backdrop in recent weeks, with choppier risk sentiment and shifting rate expectations reshaping the macro narrative. US assets have been particularly sensitive to signs of cooling labour-market momentum and the temporary loss of official payroll data during the government shutdown, while rising real yields in Japan and renewed fiscal tightening in the UK have added further cross-currents. Against this backdrop, Blue Chip forecasts point to a world edging gradually toward easier monetary policy, but with a striking divergence between a more dovish Fed and a still-normalising Bank of Japan (chart 1). The softening in US private payroll growth, captured by the ADP data, reinforces the case for Fed easing at a time when official data are unavailable (chart 2). In the euro area, sticky underlying inflation could leave the ECB wary of further meaningful cuts (Chart 3). Japan’s climb in real JGB yields, underpinned by stronger capex and supportive policy signals, continues to reverberate through global rate markets (chart 4). In the UK, the gilt–Treasury spread has widened over the year but narrowed slightly post-Budget as investors priced the growth-dampening effects of fiscal tightening (chart 5). And in the global goods sector, while the manufacturing PMI still points to only mediocre growth, the revival in South Korean semiconductor exports underscores the extent to which AI-related demand remains one of the few clear bright spots in an otherwise subdued industrial landscape (chart 6).
 Global| Dec 04 2025
Charts of the Week: Diverging Paths, Converging Risks
by:Andrew Cates
|in:Economy in Brief
 USA| Dec 04 2025
U.S. Factory Orders Unexpectedly Increase in September
- Shipments are steady.
- Order backlogs post firm increase.
- Both durable & nondurable goods inventories slip.
by:Tom Moeller
|in:Economy in Brief
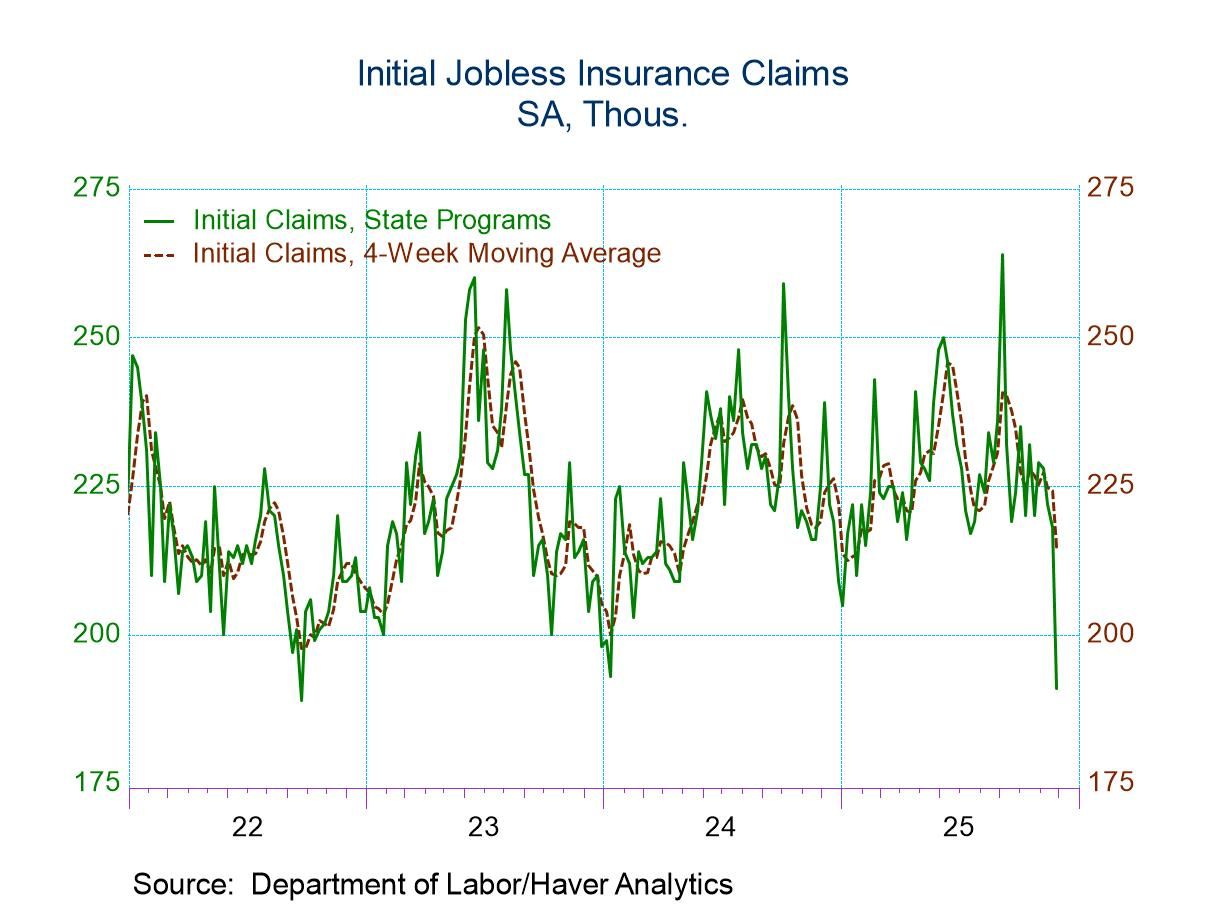
- Decline in initial claims at lowest level since January.
- Continuing claims edge lower; jobless rate steadies.
- State unemployment rates vary.
by:Tom Moeller
|in:Economy in Brief
 Europe| Dec 04 2025
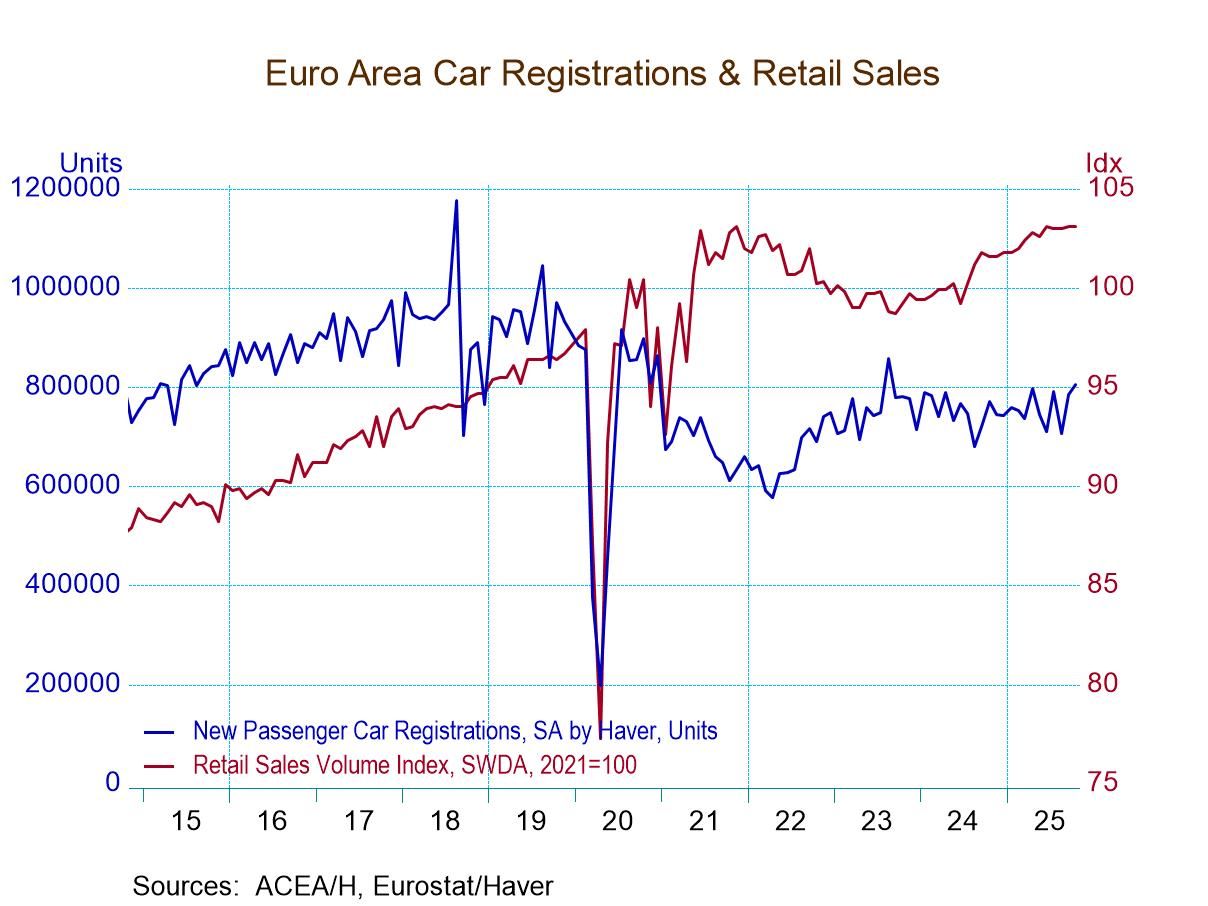
EMU Retail Sales Are Flat in October
European Monetary Union (EMU) retail sales in October were flat. Food & beverage sales rose by 0.3%. The profile on sales continues to be weak although from 12-months to six-months to three-months sales are still growing. However, the growth rates are decelerating sequentially. Total sales volumes grow by 1.5% over 12 months, advance at a 0.6% annual rate over six months, and gain at an even slower 0.4% annual rate over three months. Food & beverage volume spending rises by 1% over 12 months and at a 2.1% annual rate over three months after declining 0.4% over six months.
Quarter-to-date total euro area sales volumes are rising at a 0.4% rate while food volume is rising at a 1.9% annual rate. None of this is impressive.
Motor vehicles show healthier trends Motor vehicle sales have shown some life the last two months after falling 10.8% in August; they snapped back, rising by 11.3% in September and now, in October, there's a further 2.5% increase month-to-month. Over 12 months vehicle sales rise by 4.5%, over six months sales slow to a 1.8% annual rate, but then, over three months, they pick back up to grow strongly at a 7.4% annual rate. As a result of these gyrations, motor vehicle sales volumes are up at a 40.8% annual rate in the quarter-to-date, that's one-month into the fourth quarter.
Country level retail performance On a country-by-country basis, we have a smattering of results from Monetary Union members and other European reporters. In October, among the seven individual countries reporting, there are sales declines in three of them; in Germany sales fell by 0.3%, in Sweden they fell by 0.3%, and in the United Kingdom volumes fell by 1.1%. In addition, sales were flat in Spain in October and flat in Norway as well. Only Denmark and the Netherlands logged sales increases. Dutch sales rose 2.6% month-to-month while Danish sales rose by 0.9% month-to-month.
Sequential country sales patterns Sequentially, looking at annualized growth rates over 12 months, six months and three months, there are steady decelerations in two countries in the table: Germany and Norway. For Germany sales grow 0.9% over 12 months but move on to contract at a 1.7% annual rate over three months. For Norway sales rise by 3.4% over 12 months, then contract at a 1.2% annual rate over three months. There's a slight acceleration in sales in Denmark as sales grow 3.8% over 12 months, rise at 3.9% annual rate over six months, and then advance at a 5.4% annual rate over three months. However, the rest of the countries in the table produce unclear trends.
On a quarter-to-date basis, motor vehicles are surging, rising at a 40.8% annual rate, and providing the clearest notion of all being well. Country level retail sales excluding autos are growing most strongly in the Netherlands, at an 11.1% annual rate, followed by Denmark with a 6.7% annual rate and Spain at a 2.6% annual rate. Swedish QTD sales grow at a 1.5% annual rate, as sales volumes in Germany, the United Kingdom, and Norway show declines. U.K. sales fall at a 2.7% annual rate, German volumes fall at 1.5% annual rate, and Norwegian volumes fall at a 1.4% annual rate.
Results since January 2020 The COVID and post COVID period results to date have been marked by significant weakness. Retail sales since January of 2020 show total Euro-Area sales volumes are up by 5.7%, that's barely 1% per year. Food and beverage volumes are up by only 1% on a net basis. By country, the UK shows sales falling on balance by 3.7% on this five- and three-quarter-year horizon. Sales rise 1.7% in Sweden, 3.6% in Germany, and 4.1% in Norway. There are slightly more substantial sales in Denmark with a gain of 5.5%. The Netherlands show a net sales gain of 6.9%, and Spain logs a net rise of 9%. So, the Spanish numbers are quite solid. The Dutch and Danish numbers are moderate, and apart from that the other sales numbers are quite weak. These sales results span a period of 5 ¾ years and over such a period we would expect more substantial gains than what these countries are reporting now. Compounded a 1% per-year gain would results in a 5.9% increase in sales on this period. However, over this span vehicle sales are lower by 8.9%. That’s a substantial setback over such a period. Only two countries surpass that marker, and one other one comes close. The overall euro area number comes close (5.7%).
Summing up Retail sales numbers do not signal recession; however, they continue to point to very weak retail sales. Vehicle sales have picked up recently and have showed increases in all three horizons and that's certainly a bright spot and welcome after a long span of underperforming. Across the European Monetary Union, consumer confidence continues to lag and that weakness is reflected in the ongoing sluggishness in retail sales.
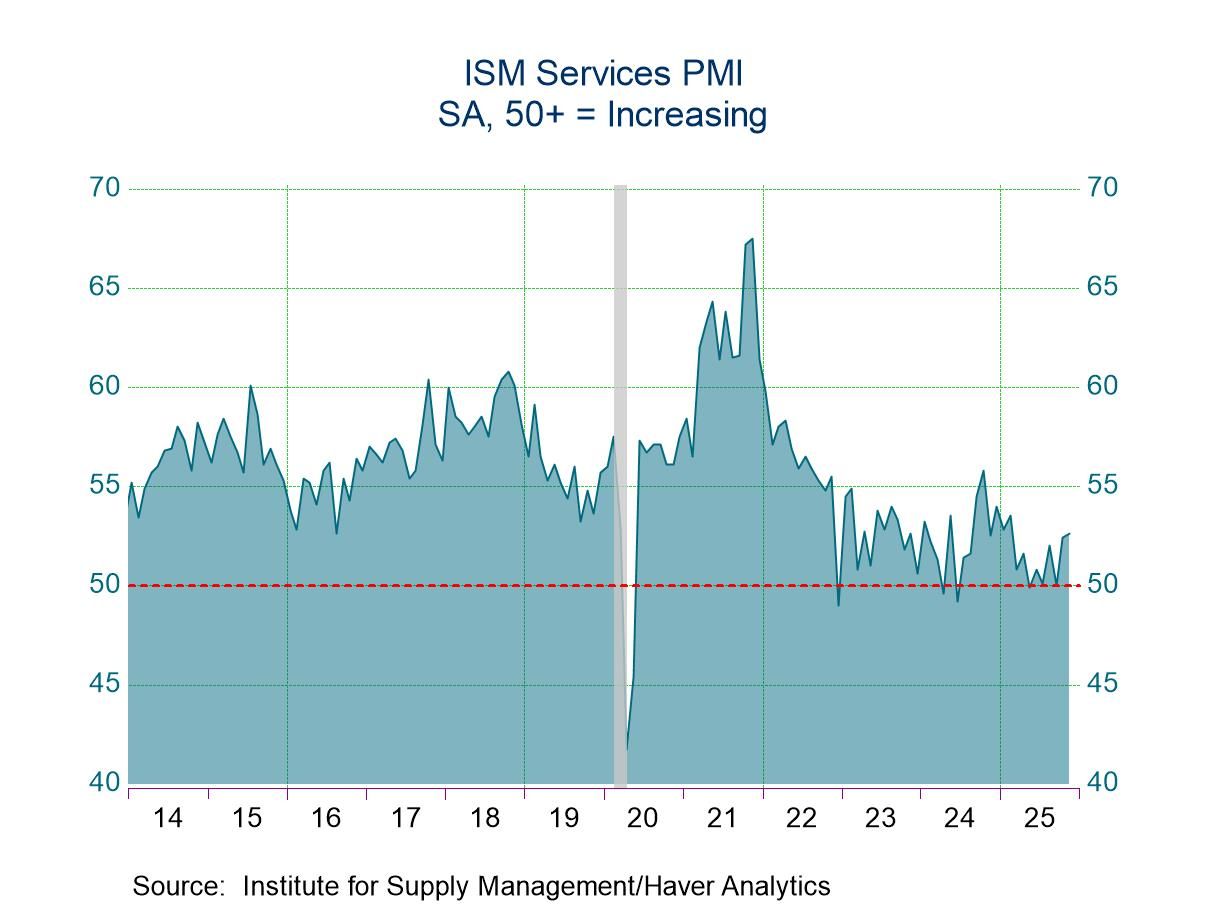
- Total services index is highest in nine months.
- Business activity, employment & supplier deliveries increase.
- Prices index declines sharply.
by:Tom Moeller
|in:Economy in Brief
 USA| Dec 03 2025
U.S. ADP Employment Declines in November
- Drop in private payrolls is third in four months.
- Hiring shortfall is led by small business.
- Both service-sector & factory jobs decline.
- Wage growth decelerates.
by:Tom Moeller
|in:Economy in Brief
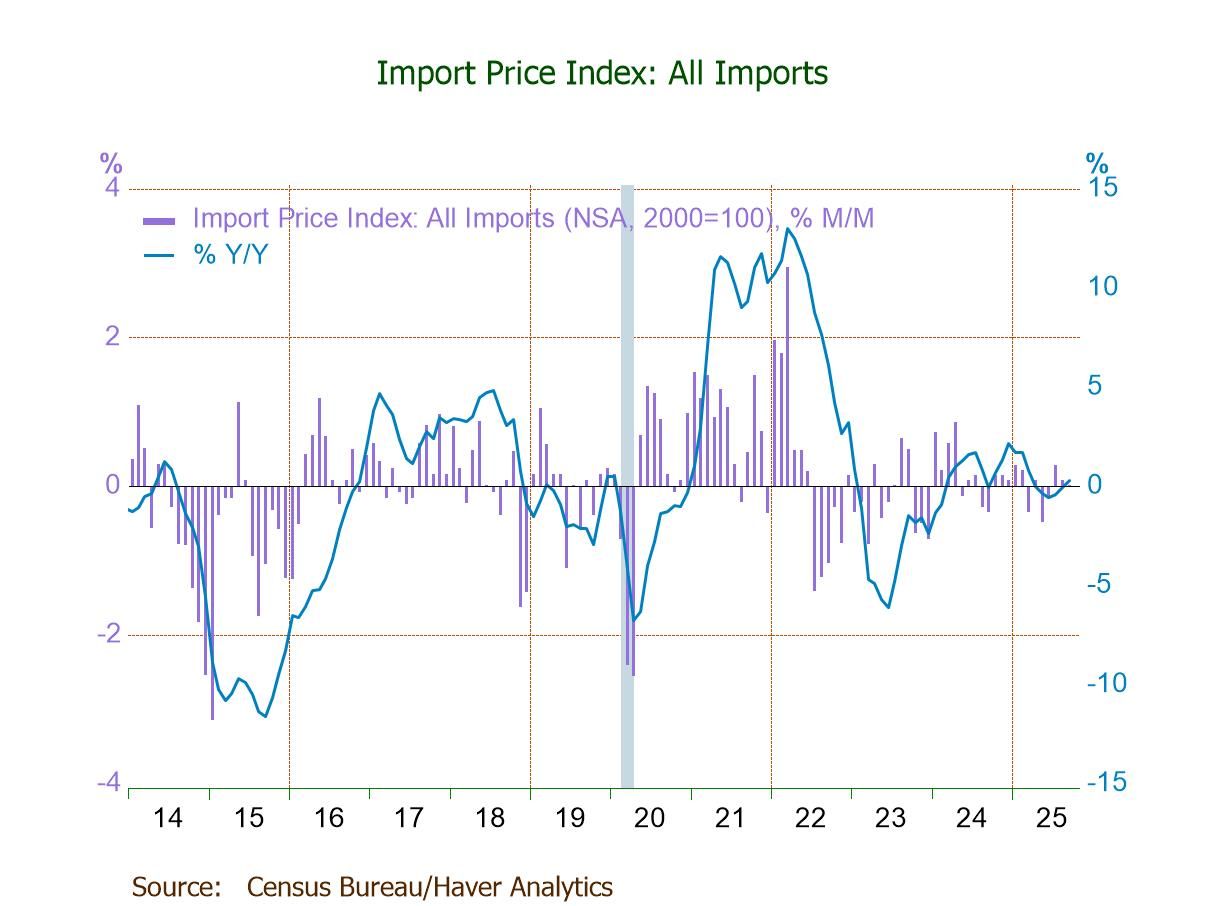
- Import prices unchanged (+0.3% y/y) in Sept. after two straight m/m rises, largely due to a 1.5% drop in fuel import prices.
- Excluding fuels, import prices up 0.2% (0.8% y/y), the third straight m/m increase.
- Export prices unchanged (+3.8% y/y), reflecting a 0.3% rebound in agricultural exp. prices and no change in nonag exp. prices.
 USA| Dec 03 2025
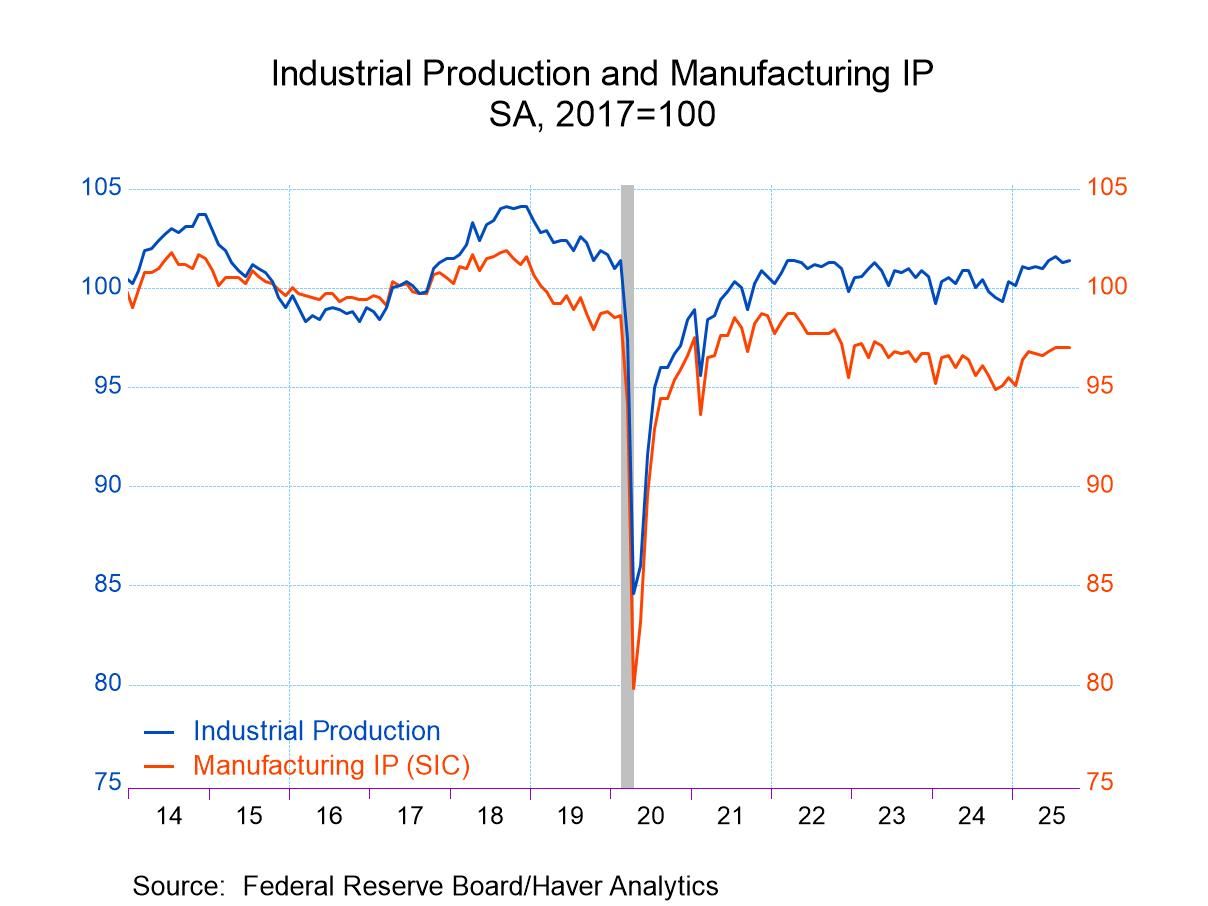
U.S. Industrial Production Edged Up in September
- IP edged up 0.1% m/m in September with a downward revision to August.
- Manufacturing and mining production were unchanged.
- Utilities output rebounded 1.1% m/m.
- Capacity utilization unchanged.
by:Sandy Batten
|in:Economy in Brief
- of2723Go to 45 page