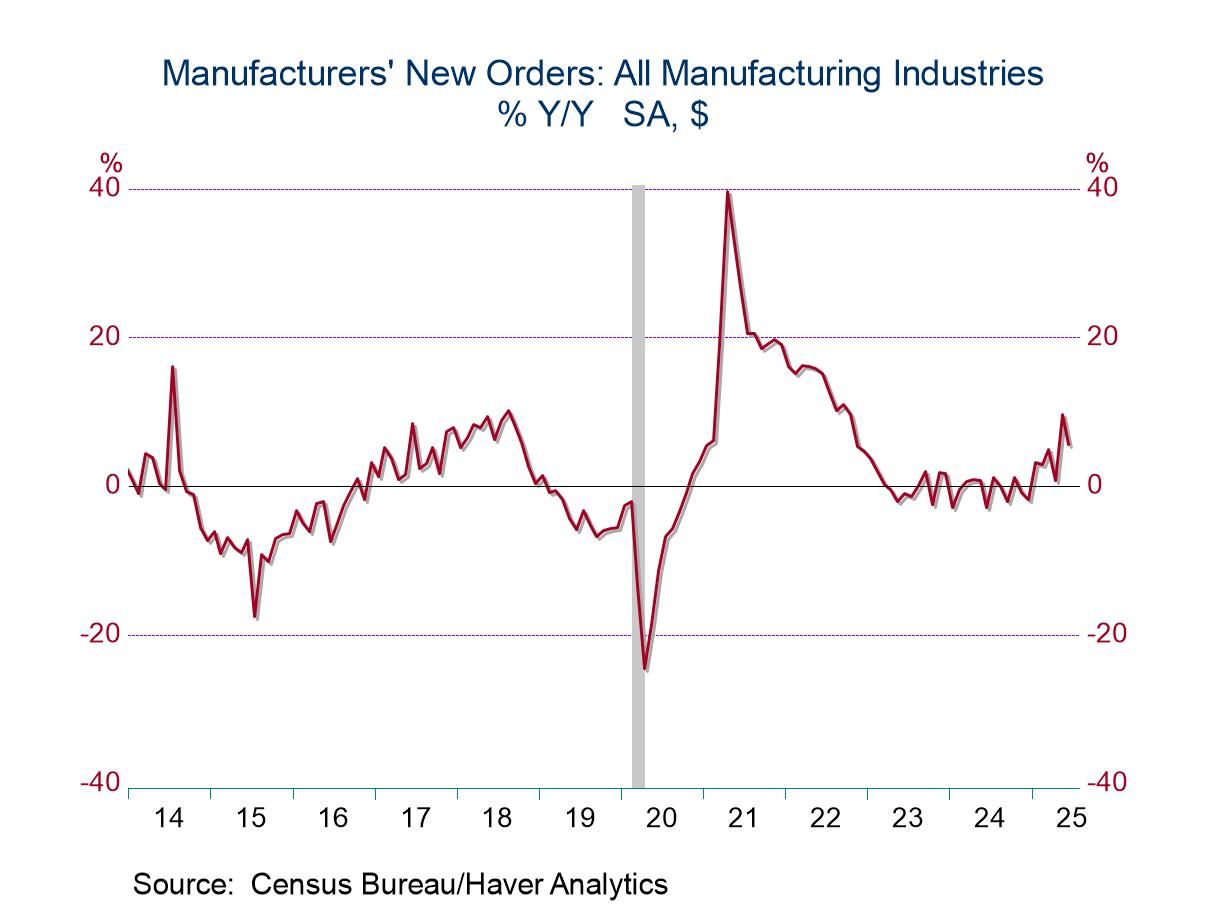
- Total orders less transportation rise moderately.
- Shipments pick up.
- Unfilled orders surge as inventories rise modestly.
by:Tom Moeller
|in:Economy in Brief
 Asia| Aug 04 2025
Economic Letter from Asia: New Duty Roster
This week, we examine the latest wave of trade developments across Asia as the US unveiled a full list of its modified reciprocal tariff rates, set to take effect on August 7. As anticipated, many of the updated rates are now lower than the original tariffs, with Cambodia and Vietnam seeing the sharpest reductions (chart 1). However, from peak tariff levels, China stands out—continuing to benefit from a 10% pause rate, down from triple-digit highs.
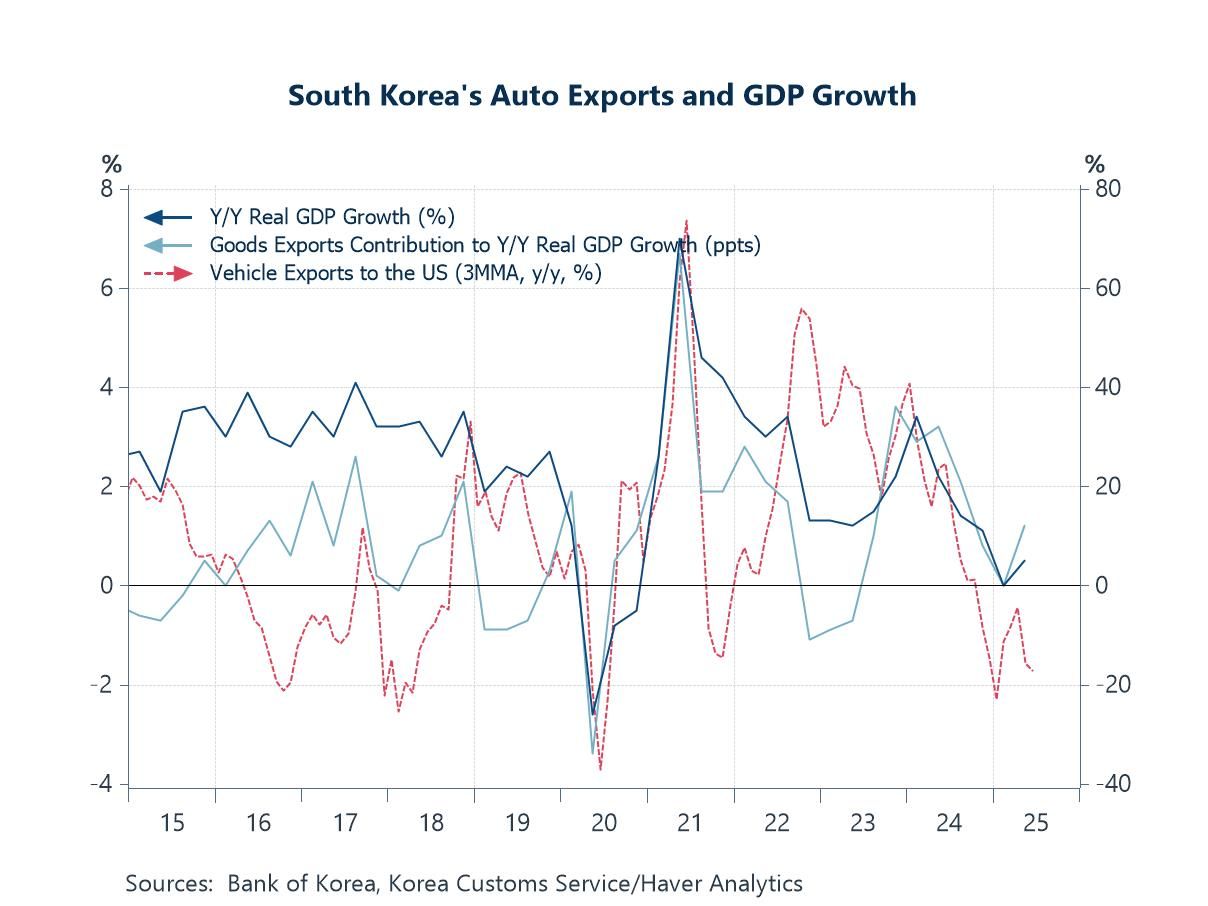
South Korea secured a deal just before the deadline, lowering its tariff from 25% to 15%. The new rate also applies to auto exports, offering relief to Korean automakers (chart 2). Thailand and Cambodia followed with US trade agreements after agreeing to an unconditional ceasefire following earlier military clashes. Their US-imposed tariffs dropped from 36% to 19%, highlighting how US trade policy can intersect with geopolitical interests and, in this case, may help reduce trade uncertainty (chart 3).
Malaysia, a key mediator in the ceasefire, also finalized a trade deal, reducing its tariff rate to 19% and gaining exemptions on key exports such as semiconductors (chart 4). Turning to Japan, while its US trade deal helped avert immediate tensions, the vague terms and a headline $550 billion investment—mostly in the form of loans—leave room for future friction (chart 5). China, however, remains a wildcard. Talks to extend its tariff pause are ongoing, but failure could see a return to extreme tariff levels (chart 6). Meanwhile, tech tensions linger, despite eased restrictions on Nvidia AI chip exports.
Latest US tariff developments We gained further clarity on the new reciprocal tariff rates announced by the US administration last week, as the White House released a full list of the modified rates on Thursday. It also announced that the new rates will take effect on August 7, giving partner countries a bit more time to negotiate new terms. Overall, as earlier indications suggested, Trump’s post-pause tariff rates—regardless of whether trade deals were secured—have often ended up lower than the original rates, as shown in chart 1. The largest reductions from original tariff levels have so far come from Cambodia and Vietnam. However, when looking at the steepest reductions from peak tariff rates, China stands out. It continues to benefit from a 10% tariff pause—down sharply from the triple-digit rates imposed at the height of US-China trade tensions earlier this year. On the flipside, a handful of economies—including New Zealand, the Philippines, and Brunei—are now facing modified tariff rates that are actually higher than their original Liberation Day levels. Notably, the Philippines ended up in this group despite having secured a trade deal with the US.
- USA| Aug 01 2025
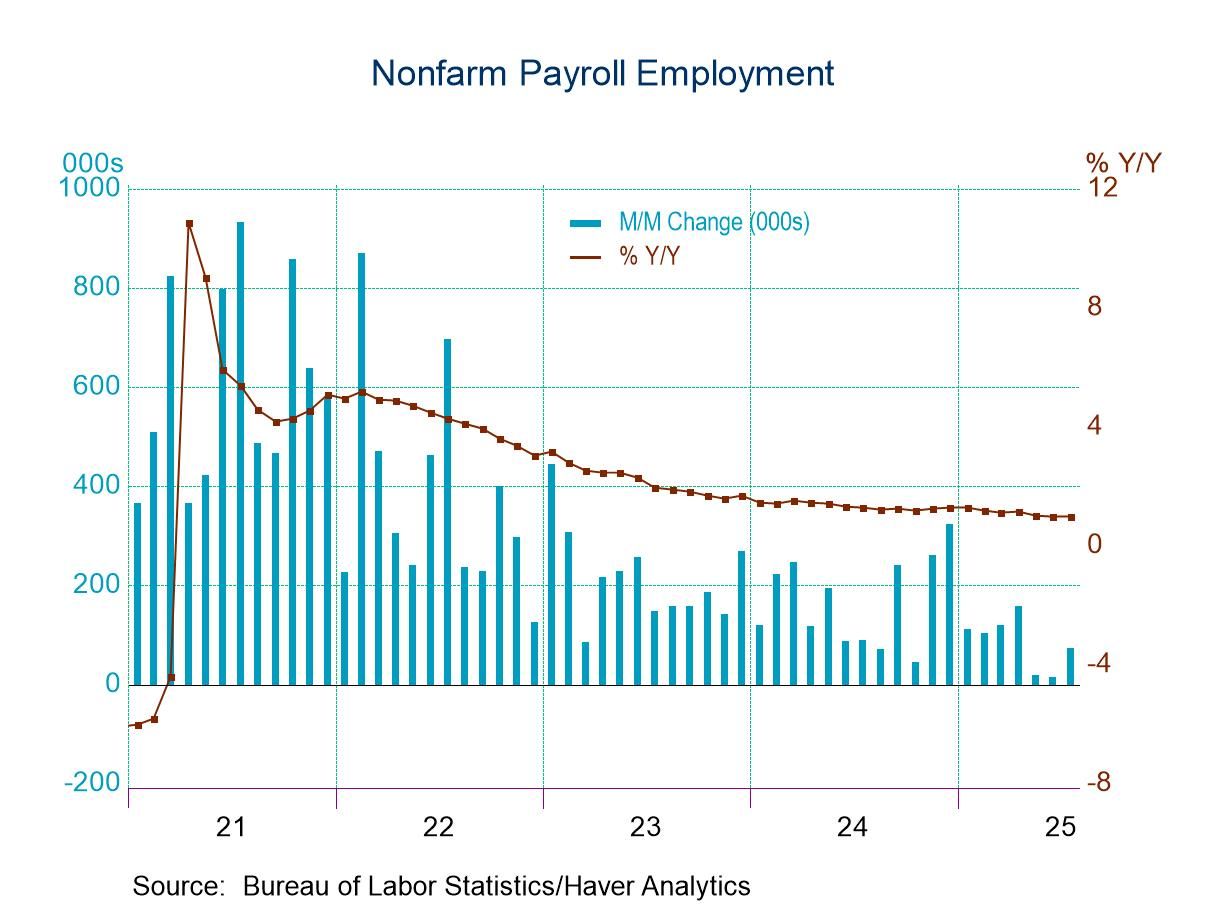
U.S. Employment Report Shows Weakness in July, While Revisions Reduce Earlier Gains; Jobless Rate Picks Up
- Recent job growth reduced by fewer factory & government jobs.
- Earnings gain remains steady y/y.
- Jobless rate reverses June decline.
by:Tom Moeller
|in:Economy in Brief
- USA| Aug 01 2025
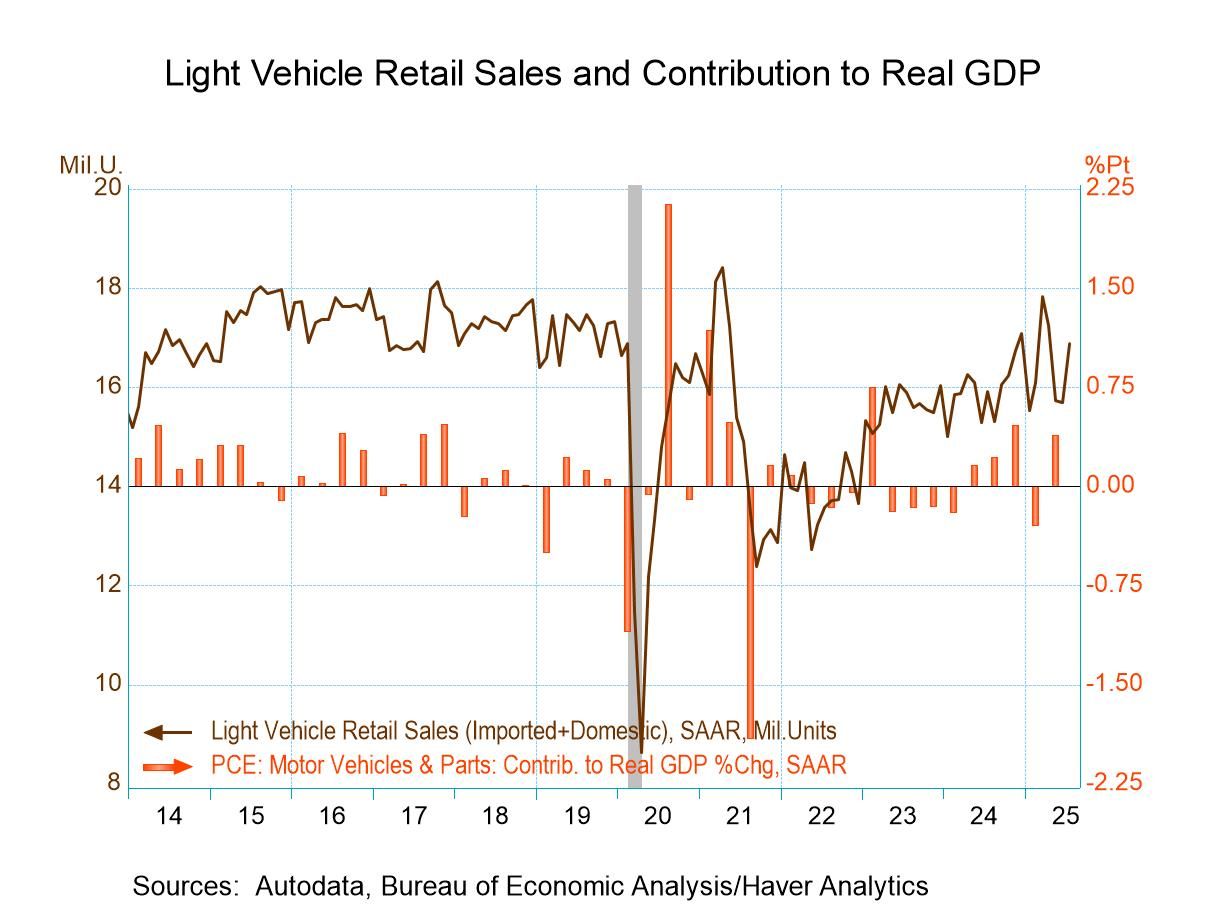
U.S. Light Vehicle Sales Rebound in July
- Both light truck and auto sales recover.
- Domestic and imports each increase.
- Imports' market share steadies.
by:Tom Moeller
|in:Economy in Brief
- USA| Aug 01 2025
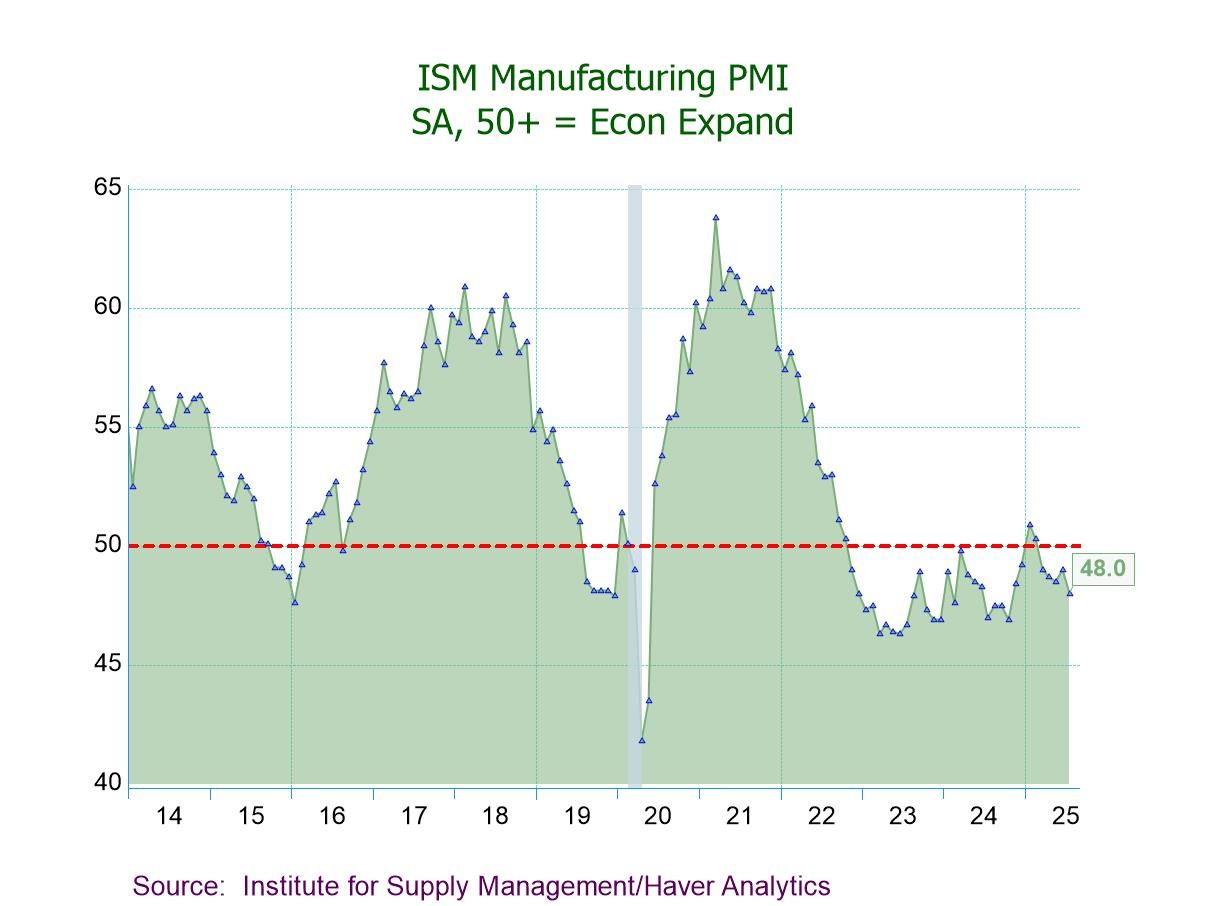
U.S. ISM Manufacturing PMI Contracts in July to a Nine-Month Low
- 48.0 in July vs. 49.0 in June; the fifth consecutive month of contraction.
- Production (51.4) expands to a six-month high.
- New orders (47.1) contract for the sixth successive month.
- Employment (43.4) contracts to the lowest level since June ’20.
- Prices Index (64.8) indicates prices rise for the 10th straight month; exports & imports contracting.
- USA| Aug 01 2025
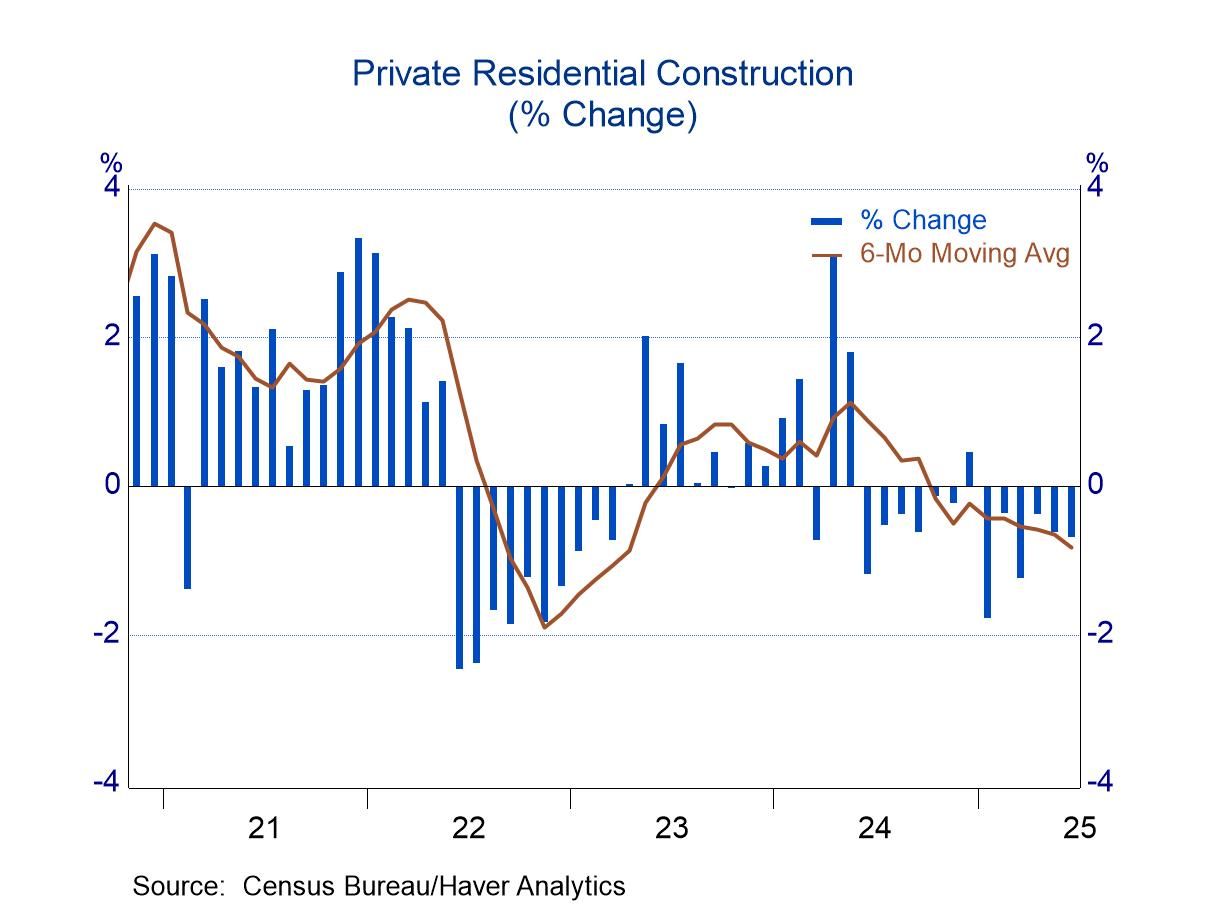
U.S. Construction: Sluggish in June
- Private building, both residential and nonresidential, drifting lower.
- Public construction hesitating after two strong years.
 Global| Aug 01 2025
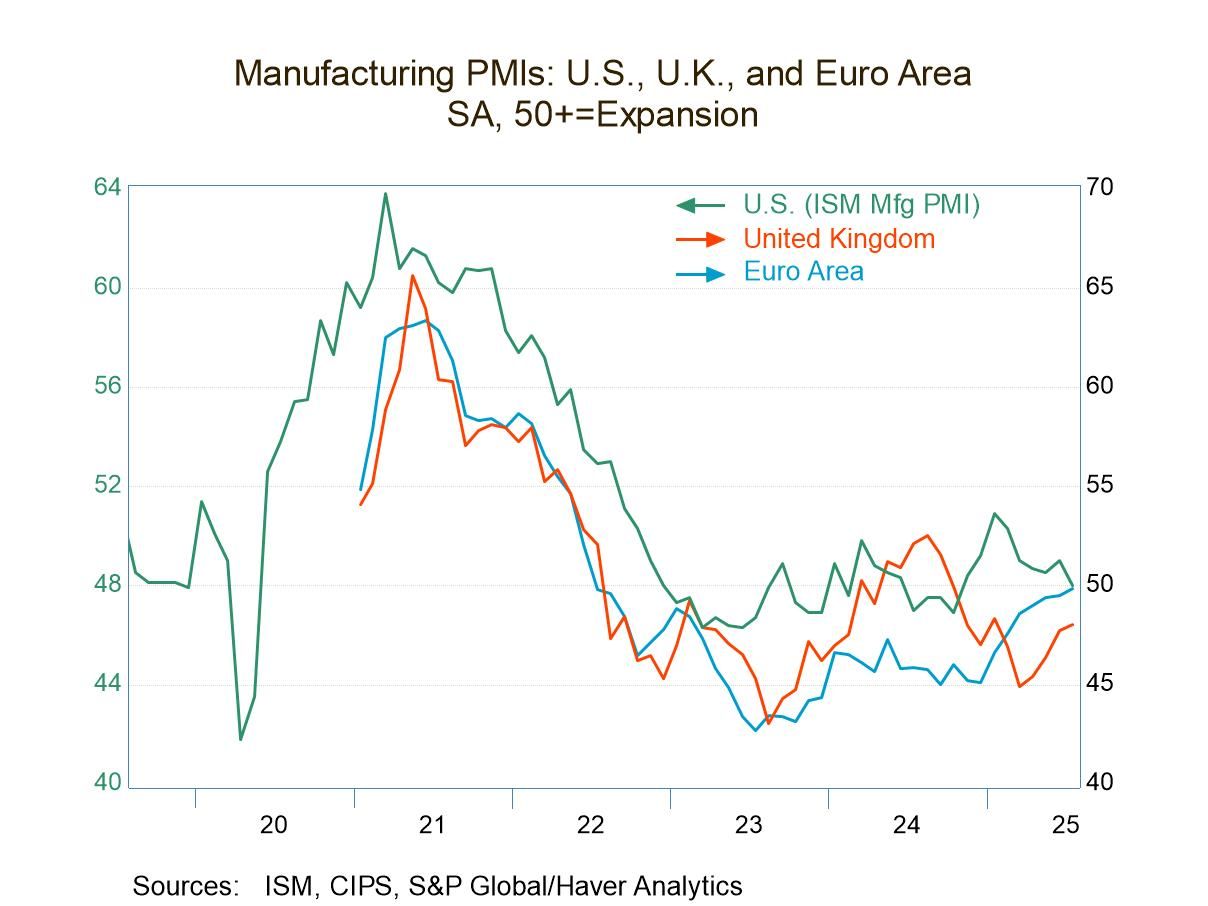
Manufacturing PMIs Rank Low and Show Ongoing Weakness
Manufacturing PMIs in the S&P framework were mixed in July. However, the median reading edged slightly higher rising to 48.6 in July from 48.5 in June. But both of these are significantly weaker than the 49.1 reading in May. Manufacturing continues to post PMI readings that are below 50 indicating sector contraction on a fairly broad basis in July among the 17 reporting countries in the table plus the euro area. Only India and Vietnam reported PMI readings above 50 indicating sector expansion in July. In June, three of these jurisdictions showed readings above 50; in May, only three had readings above 50 as well. It remains a difficult time for manufacturing globally.
The readings for the manufacturing PMIs also show slippage in the medians from 12-months to six-months to three-months. The 12-month median is 49.2, the six-month median at 48.8, and the three-month median at 48.7. The bottom line is that most manufacturing sectors show contraction, and the contractions are generally getting slightly worse.
However, on an individual basis over three months about two-thirds of the reporters showed an improvement. Over six months just under 40% showed improvement and over a year about 44% of them showed improvement compared to the year before. Only the three-month versus six-month comparison shows a majority of reporters indicating better performance in July.
The ranked or queue standings metrics that place these individual readings for July in their queue of data over the last 4 ½ years, show standings above 50% which put the individual readings above their medians for this period. And only six of these eighteen reporting jurisdictions sported readings above 50%. Those were for the euro area, Germany, France, and India. India has a rating well above 50% at its 96th percentile; Malaysia has a reading above 50% and Vietnam has a reading well above 50% at its 74th percentile.
 Global| Jul 31 2025
Charts of the Week: Markets Rally, Risks Linger
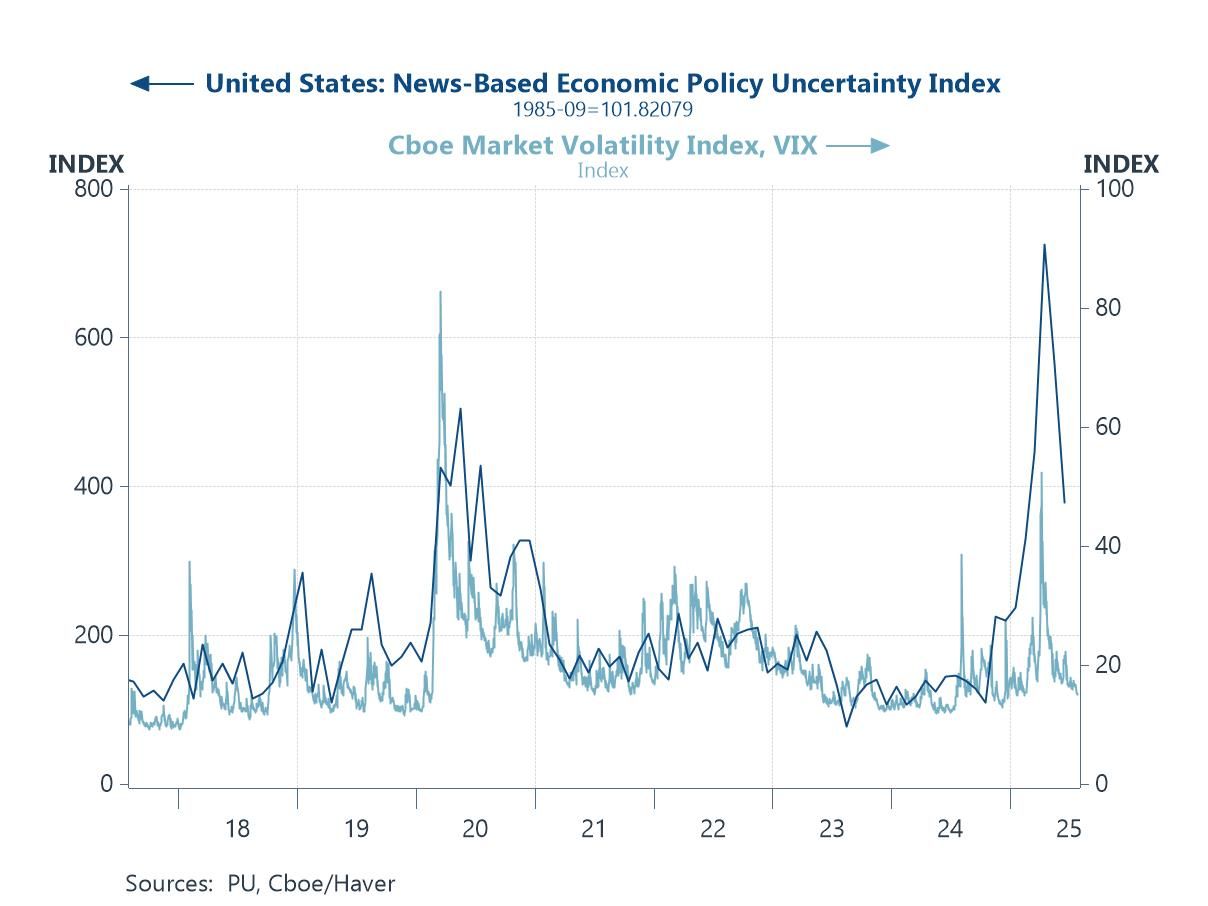
Financial markets have performed well in recent weeks, lifted by stronger data, moderating inflation, and renewed soft landing hopes. Equities have pushed higher, volatility has eased, and credit markets have firmed. While economic policy uncertainty remains elevated, it is showing signs of normalising alongside greater clarity on US trade policy (chart 1). The US dollar, however, remains under pressure amid concerns about Fed independence and broader policy credibility (chart 2). The Fed’s decision on July 30th to leave policy on hold, despite two dissenting votes in favour of a cut, arguably did little to ease those concerns. Recent US trade agreements—particularly with Japan and Europe—have boosted sentiment, though questions linger over implementation. In Japan, trade policy uncertainty has surged amid vague deal terms, even as exports to the US have weakened (chart 3). In the euro area, M3 growth slowed in June as private credit softened, casting doubt on the durability of recent upside surprises (chart 4). UK retail data signal a sharp drop in consumer activity, consistent with past recessions (chart 5), and the change in US house prices has turned negative on a three-month basis—often a warning sign of broader economic weakness (chart 6). Overall, while market sentiment has improved, risks tied to credit, demand, and housing persist.
by:Andrew Cates
|in:Economy in Brief
- of2693Go to 47 page


