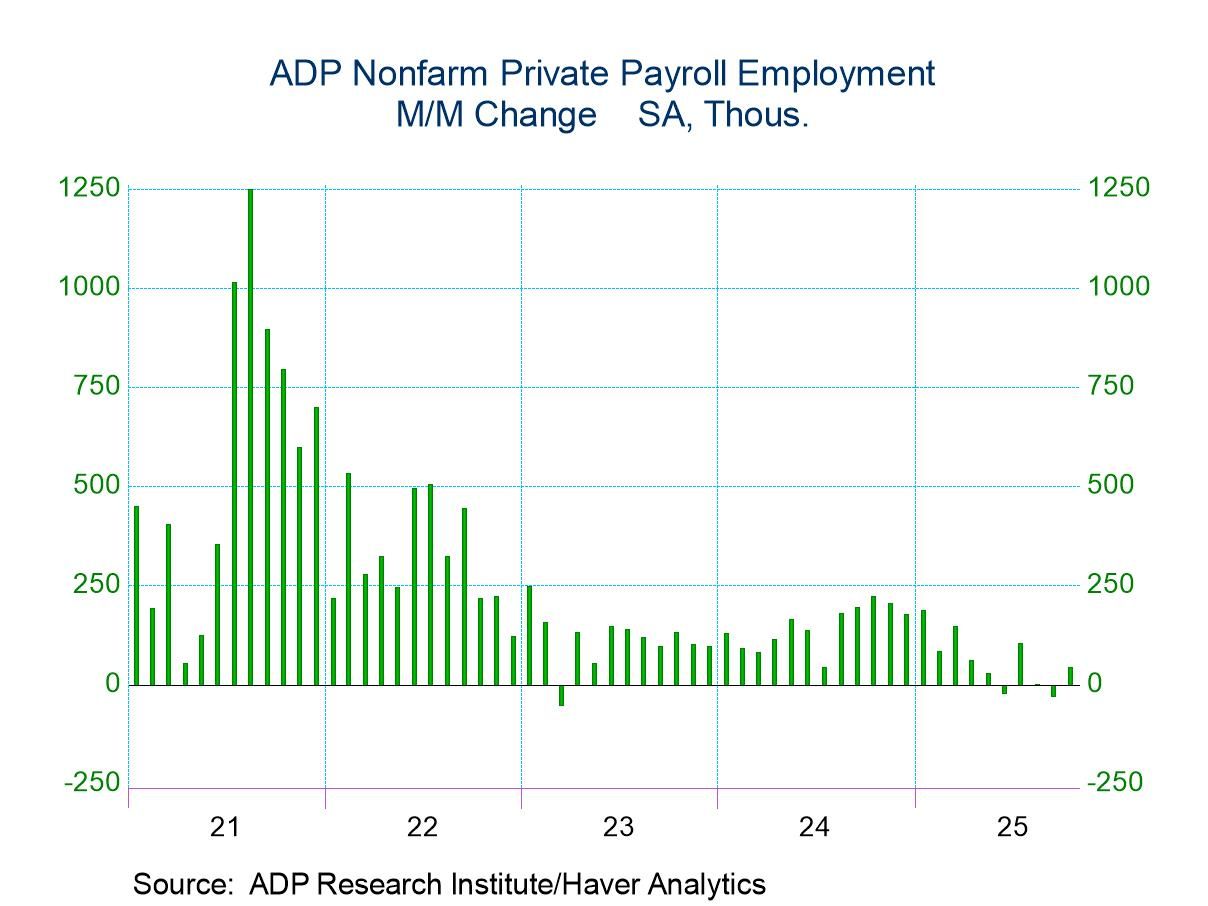
- Gain in private payrolls is first in three months.
- Service-sector & construction hirings move up, but factory jobs decline.
- Wage growth steadies.
 USA| Nov 05 2025
U.S. ADP Employment Recovers in October
by:Tom Moeller
|in:Economy in Brief
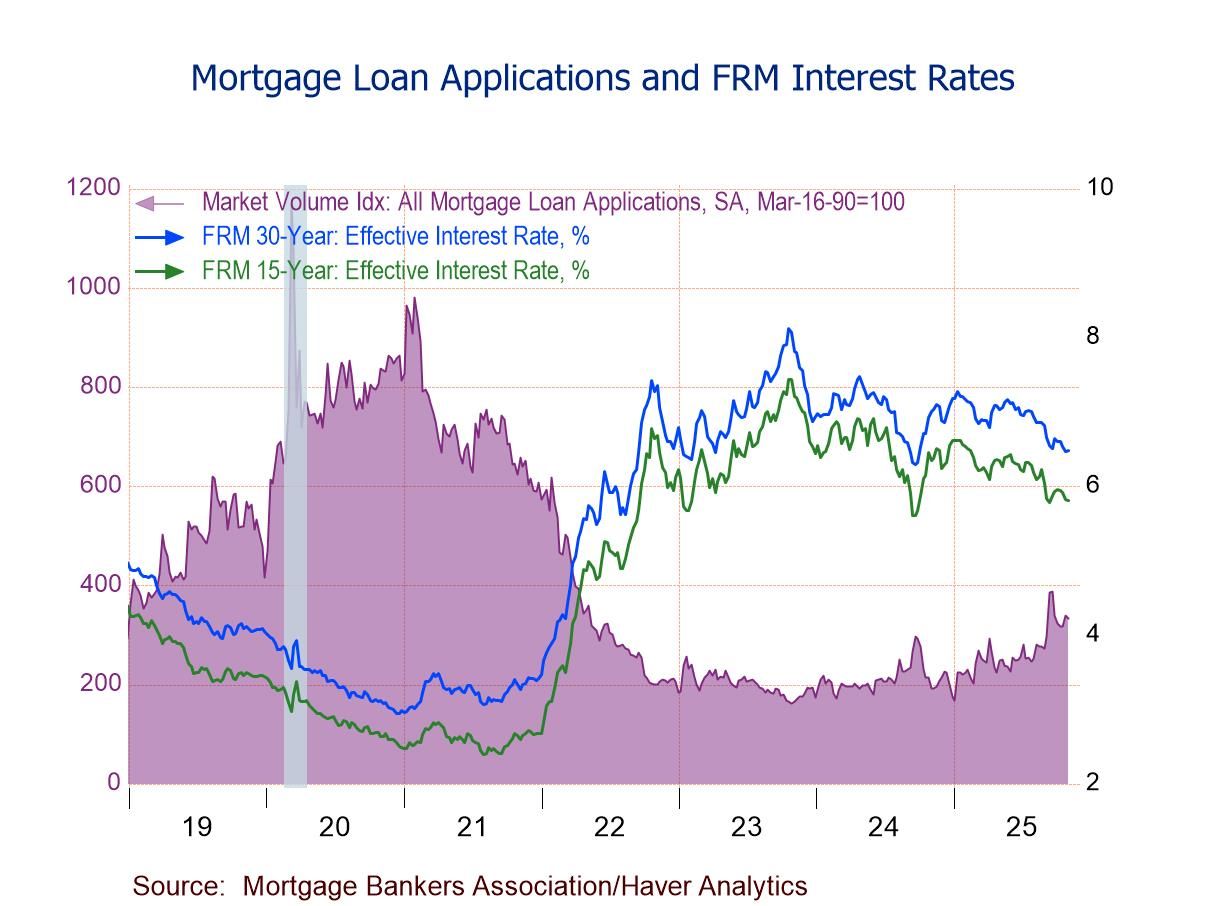
- Purchase applications -0.6% w/w; refinancing loan applications -2.8% w/w.
- Effective interest rate on 30-year fixed loans ticks up to 6.48% despite ongoing downward trend.
- Average loan size rebounds to the highest level since the September 19 week.
 USA| Nov 04 2025
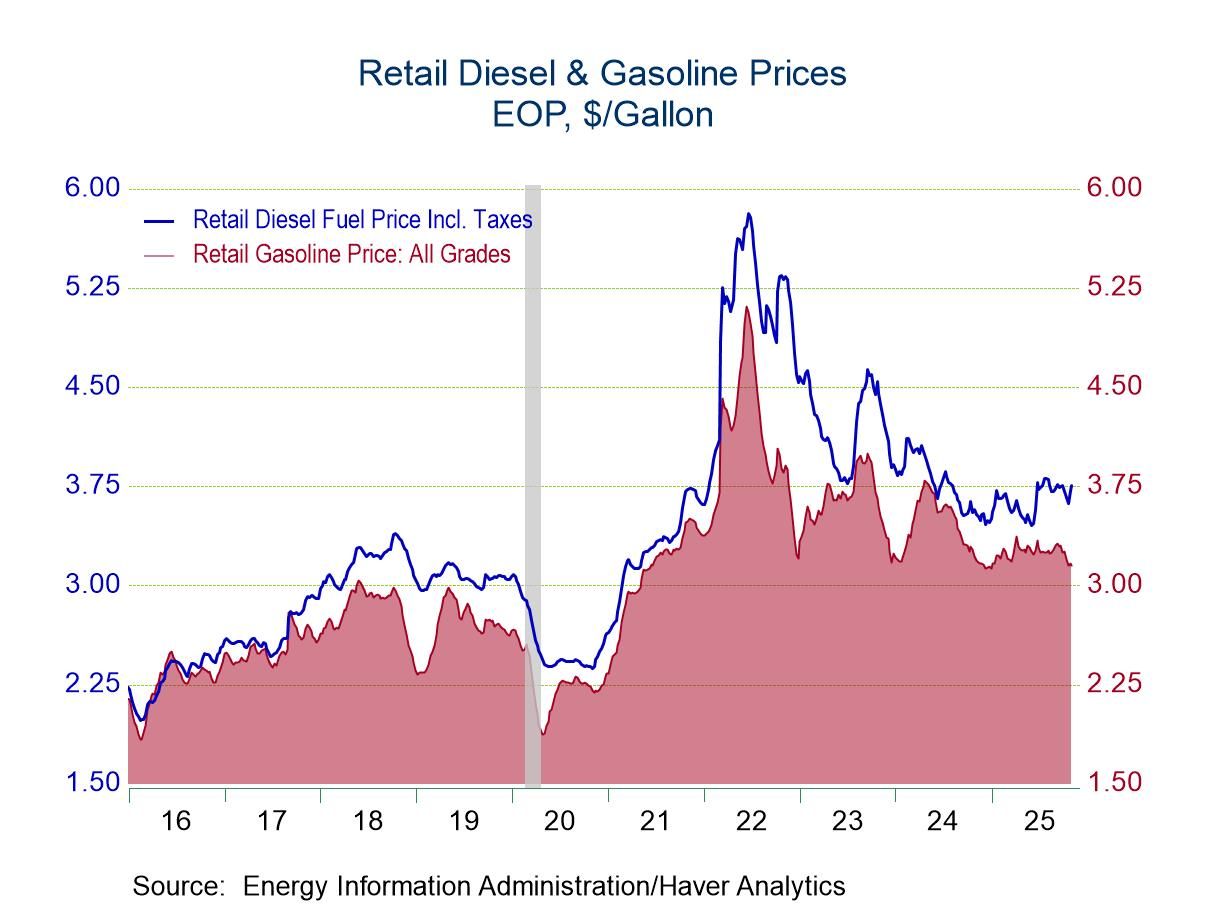
U.S. Energy Prices Are Mixed in Latest Week
- Gasoline prices are minimally changed.
- Crude oil costs rise further.
- Natural gas prices strengthen.
by:Tom Moeller
|in:Economy in Brief
 USA| Nov 03 2025
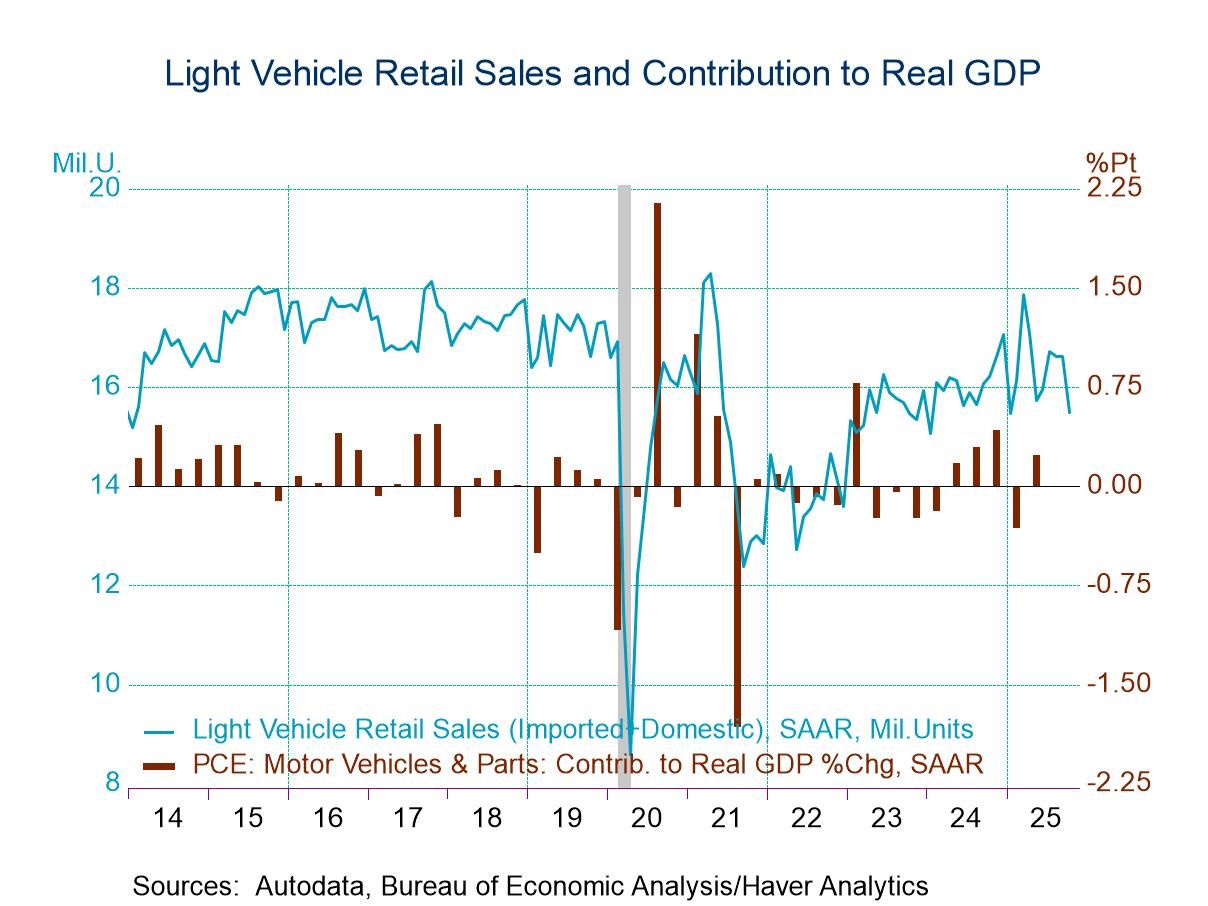
U.S. Light Vehicle Sales Fall Sharply in October
- Light truck sales and auto purchases decline m/m.
- Total sales decline sharply y/y.
- Imports' market share declines.
by:Tom Moeller
|in:Economy in Brief
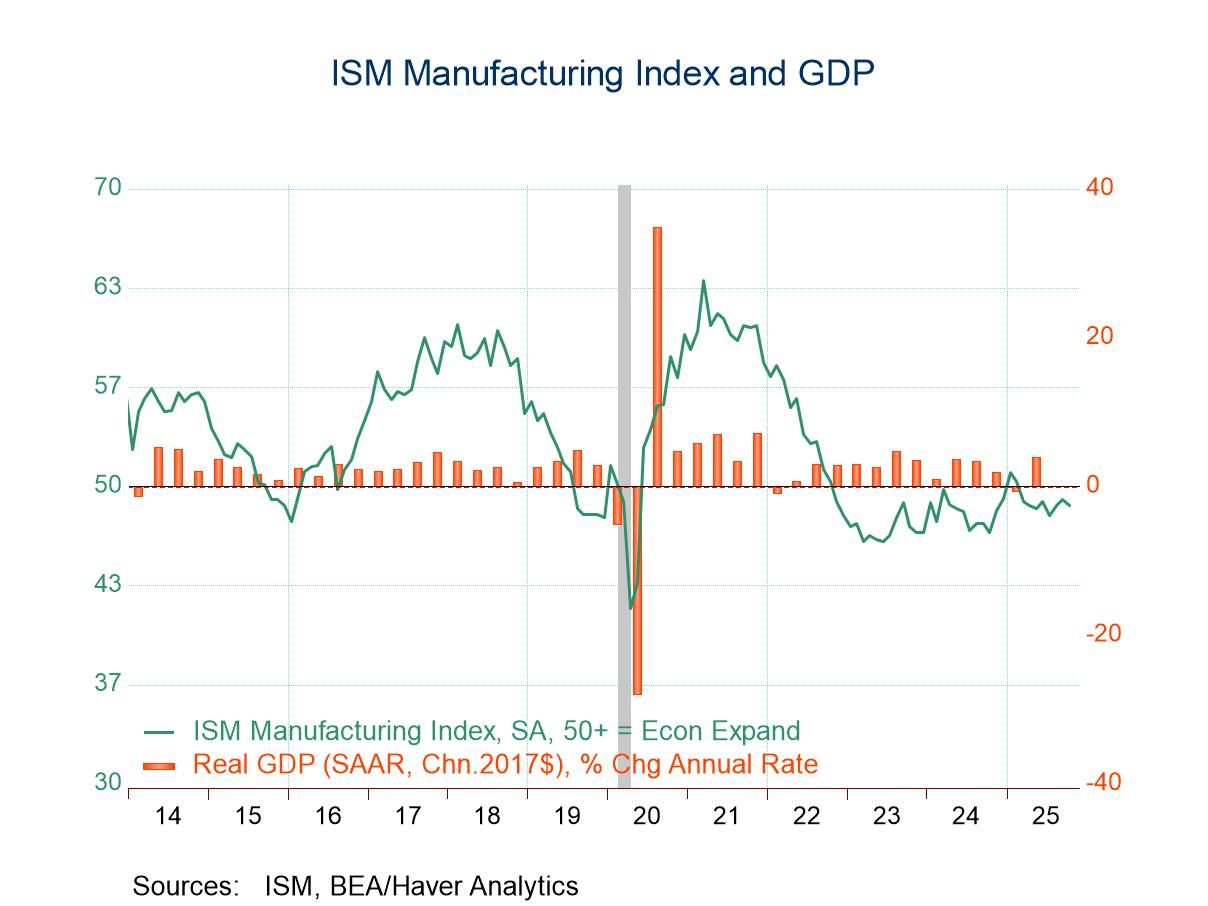
- Decline reverses all of September increase.
- Lower production offsets new orders rise.
- Price index falls to nine-month low.
by:Tom Moeller
|in:Economy in Brief
 Asia| Nov 03 2025
Economic Letter from Asia: Come Together
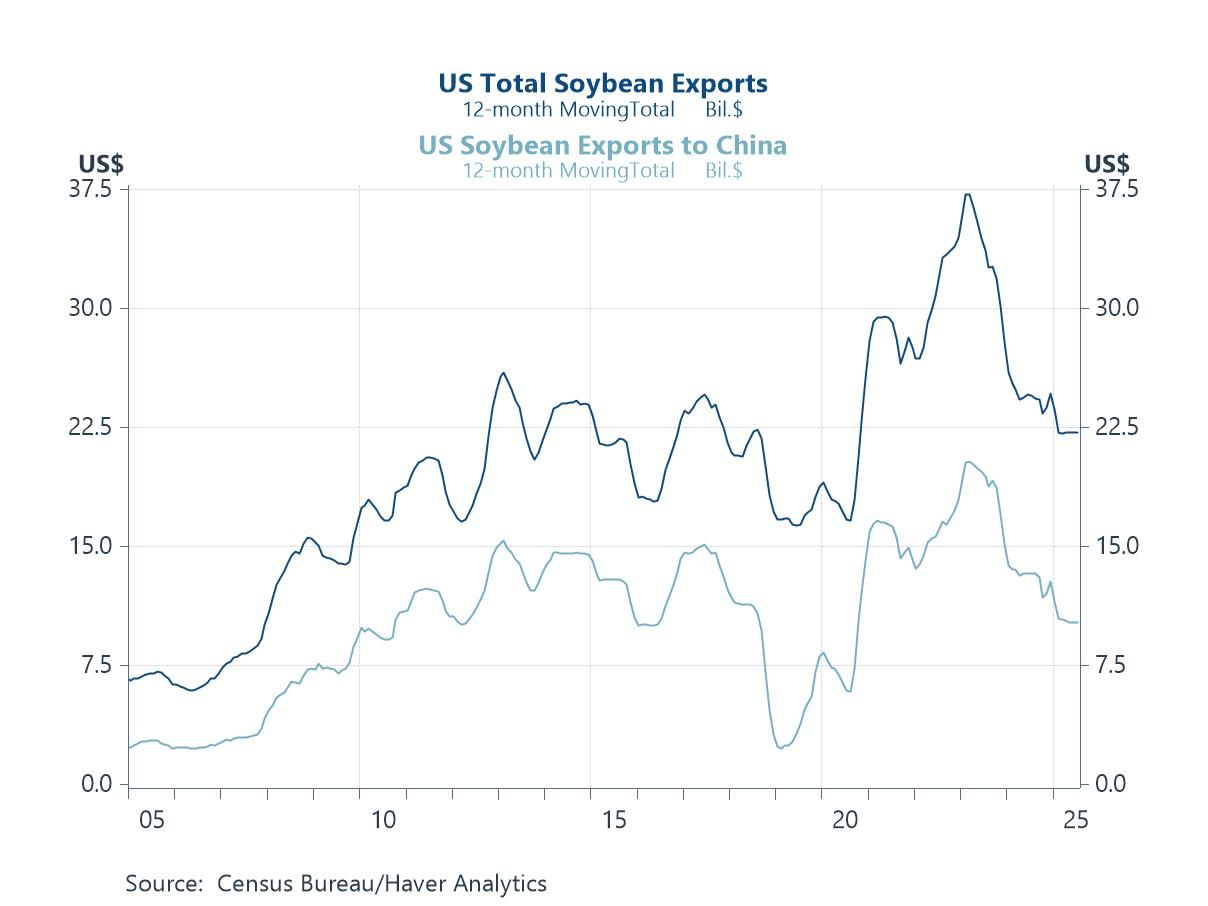
This week, we review a wave of key developments across Asia following US President Trump’s tour of the region last week. A central theme concerned countries courting closer ties with the US to avoid harsher actions, while also boosting regional cooperation amid trade barriers and scrutiny of China. This push for closer ties has manifested through new and updated trade agreements—ironically driven by ongoing uncertainty in global trade and supply chains, with US–China relations at the core. A major outcome of Trump’s trip was the new US–China trade agreement, which included the US halving tariffs on Chinese fentanyl-related products to 10%, while China suspended rare earth export controls and resumed soybean purchases vital to the US (chart 1). Perhaps more importantly, the deal signalled a small conciliatory shift and avoided a potentially worse outcome. Beyond the US–China agreement at the APEC Summit in South Korea, the US–South Korea trade deal also gained more clarity. Under the deal, US auto tariffs on South Korea has fallen to 15%, matching the rate applied to Japan and likely providing relief for South Korean automakers (chart 2).
Trump’s visit to Japan was another highlight. Relations with new Prime Minister Takaichi got off to a strong start, and further details emerged on Japan’s previously cited $550 billion investment commitment in the US—substantial even relative to Japan’s existing direct investment there (chart 3). However, specifics on the timing and implementation of the investment remain limited. Meanwhile, at the ASEAN Summit earlier in the week, aside from Trump’s engagements, the bloc officially welcomed its 11th member—Timor-Leste—the first new member in decades—granting it access to the bloc’s mechanisms and potentially supporting a catch-up in economic development (chart 5). Looking ahead, the focus on China and Japan is likely to continue, with China set to release its October trade (chart 6) and CPI data, and Japan scheduled to report employee wages and household spending.
The APEC summit The US and China made a modest but meaningful step forward on trade following the Trump–Xi meeting at the APEC Summit in South Korea. The US lowered tariffs on Chinese fentanyl-related products to 10% from 20% and suspended enforcement of rules targeting subsidiaries of blacklisted firms—previous points of contention for Beijing. In return, China pledged stronger efforts to curb fentanyl flows, paused rare earth export controls for a year, and resumed purchases of US soybeans—significant given its historically large share of US export demand (chart 1). While not a comprehensive reset, these moves eased immediate tensions and helped avert more severe outcomes, including Trump’s previously threatened 100% tariff hike. The tone of the meeting also suggests a more conciliatory shift, though relations remain fragile and the risk of renewed escalation is still material.
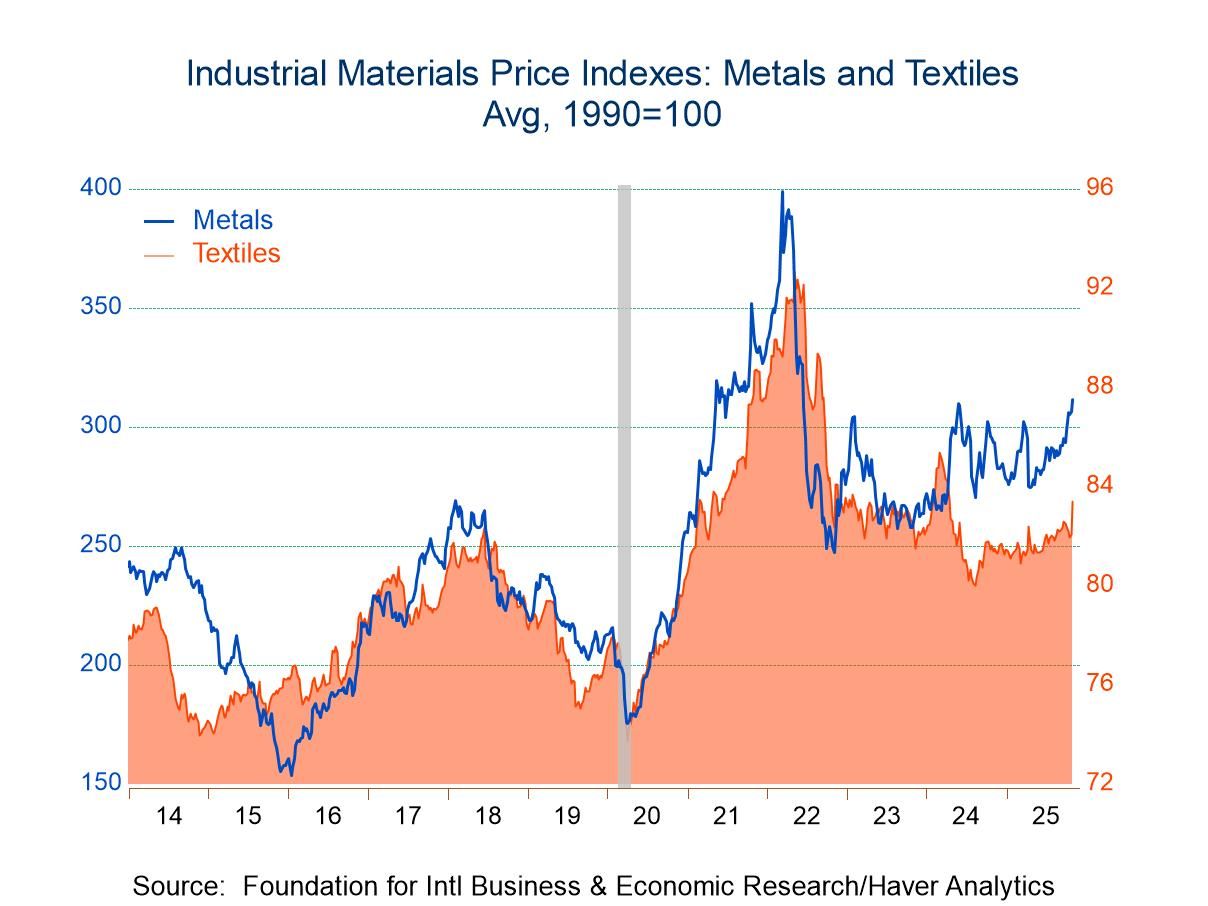
- Metals and textile prices strengthen.
- Framing lumber costs backpedal.
- Crude oil prices weaken.
by:Tom Moeller
|in:Economy in Brief
 Global| Oct 30 2025
Charts of the Week: Optimism with Caveats
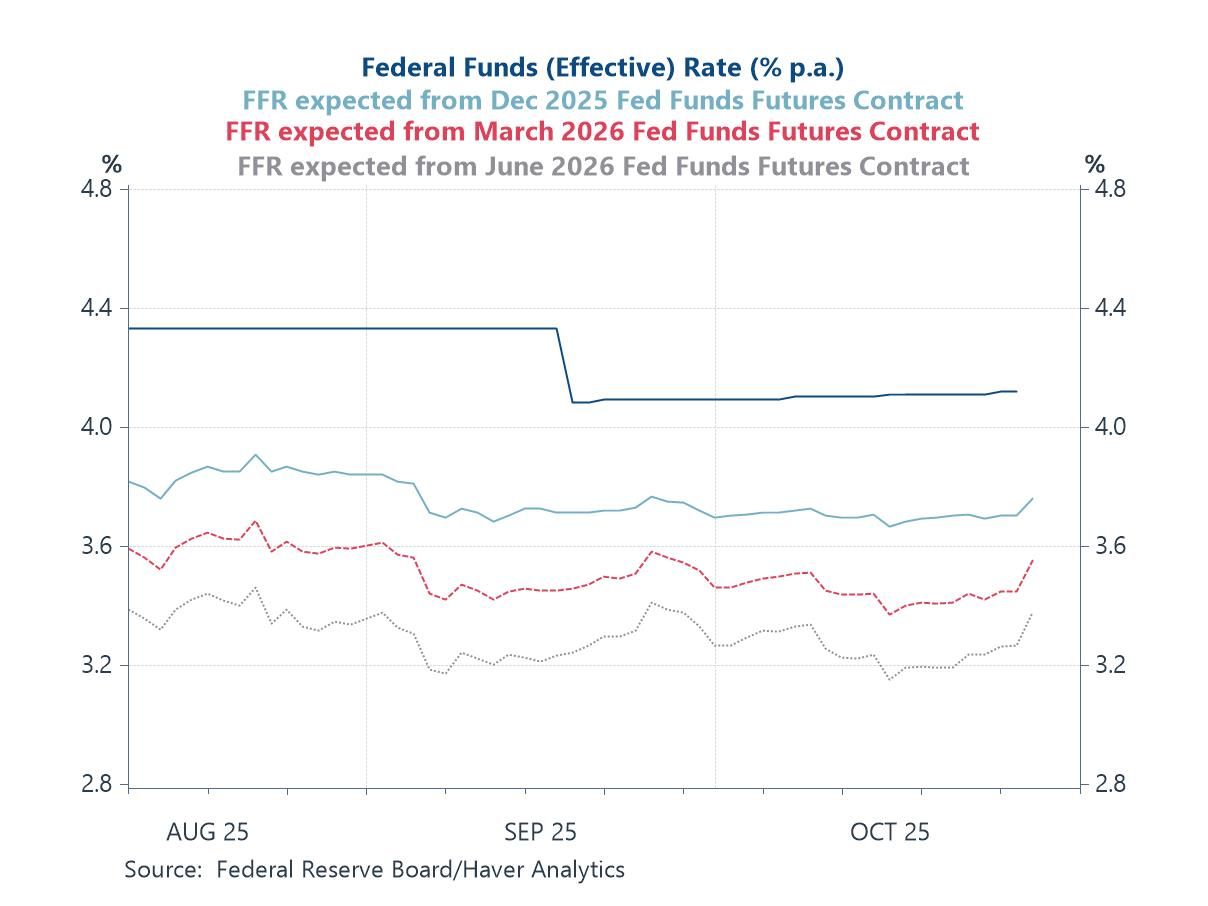
Global equity markets are once again flirting with record highs, buoyed by renewed optimism that the global economy can achieve a soft landing—and by persistent enthusiasm over the potential productivity gains from AI-related investment. The Federal Reserve’s decision to cut rates by 25bps this week—its second this autumn—initially reinforced expectations that global monetary policy is shifting toward a more accommodative stance. However, Chair Powell’s reminder that a further cut in December was “not inevitable” tempered that optimism and was met with some disappointment in financial markets (chart 1). Even so, the broader tone remains constructive, though it contrasts with a still-fragile macro environment. Renewed conflict in Gaza, the ongoing US government shutdown, and intensifying trade tensions have kept risk sentiment uneven and underscored the fragility of the recovery. The latest flash PMIs (chart 2) show modest global expansion led by services, while manufacturing continues to struggle. Consumer confidence (chart 3) tells a similar story: sentiment has weakened in the US as the labour market softens, stabilised in the euro area, and improved slightly in the UK. In the euro area, sluggish money and credit growth (chart 4) and the ECB’s latest bank-lending survey confirm that financial conditions remain mildly restrictive despite recent rate cuts. The UK CBI Industrial Trends Survey (chart 5) points to manufacturers reducing inventories and deferring investment plans amid demand uncertainty. Externally, the Drewry Container Index (chart 6) has fallen back from 2024’s elevated levels, signalling easing supply-chain pressures and subdued traded-goods inflation—though tariff realignments remain a potential source of friction.
by:Andrew Cates
|in:Economy in Brief
- of2723Go to 52 page