The European Monetary Union released an uneventful GDP report with GDP rising by 0.2% quarter-to-quarter in 2025 Q3 compared to an increase of 0.1% quarter-to-quarter in the second quarter of 2015.
At an annual rate, overall GDP rises at a 0.9% pace in the third quarter, up from 0.5% in the second quarter; that acceleration masks a deceleration in the year-over-year growth as Q3 growth is at 1.4% year-over-year compared to an increase of 1.5% year-over-year in the second quarter.
The table shows eight early-reporting monetary union members and among these eight only two of them show GDP slowing in the third quarter compared to the second quarter on quarter-to-quarter changes. Ireland slows to -0.4% after gaining by 0.9% in the second quarter. Spain’s annual rate in the third quarter falls to 2.6% compared to a 3% pace in the second quarter.
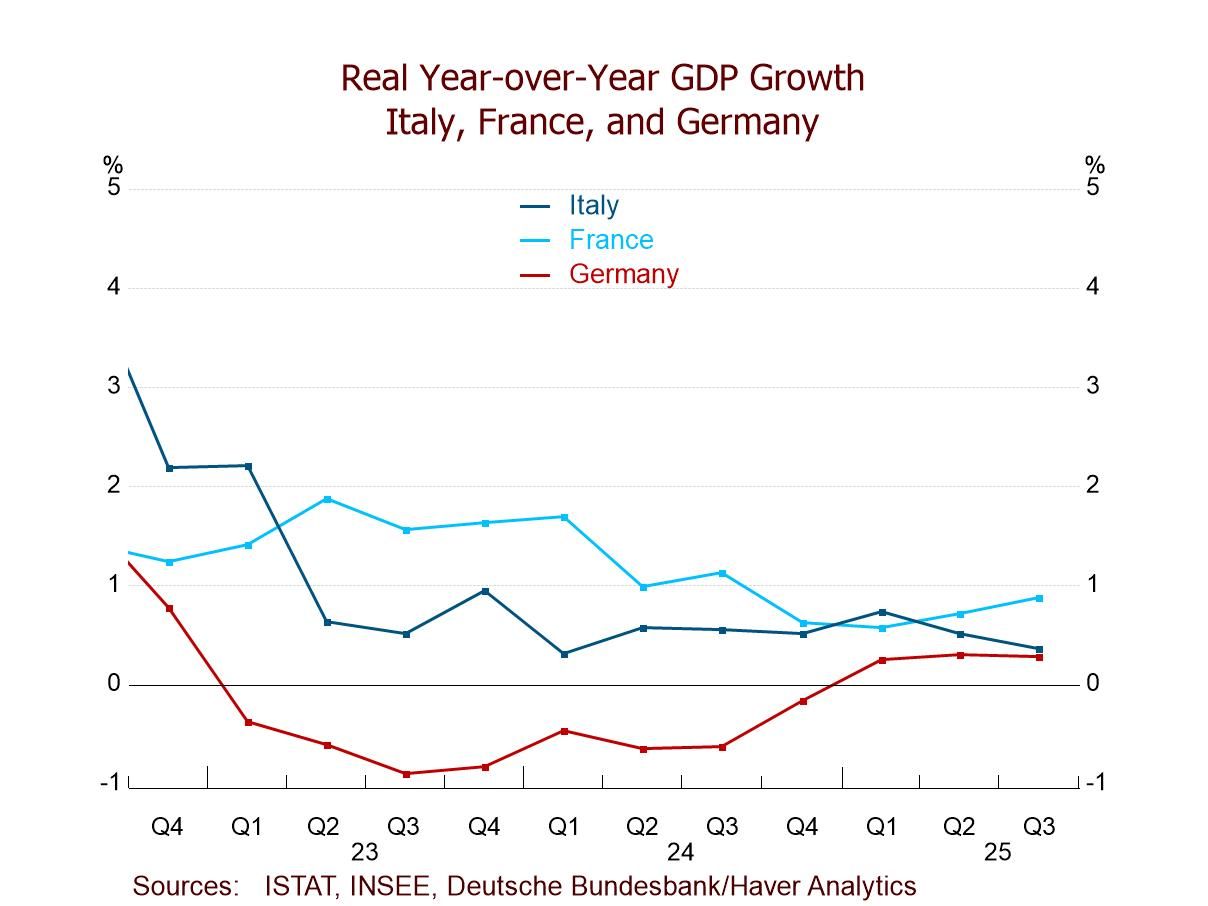
Looking at year-over-year growth rates, there are decelerations that are much more common. In fact, there are accelerations in only three of the countries: Belgium, France, and Portugal. Belgium’s GDP growth in the third quarter moves up to 1.1% from 1% in the second quarter, growth in France is at 0.9% in the third quarter compared to 0.7% in the second, while Portugal logs an increase of 2.4% compared to 1.8% year-over-year gain in the second quarter.
Looking at growth in terms of the four largest EMU economies versus the rest, large economy growth notched 0.9% in the third quarter in terms of quarter-to-quarter changes compared to 0.4% in the second quarter. Euro area growth for the large economies was unchanged 0.8% in the third quarter; in fact, it has grown by 0.8% year-over-year in the first quarter, second quarter, and third quarter of 2025. The rest of the monetary union shows growth accelerating in the third quarter to 1.1% from 0.7% in the second quarter. However, the year-over-year growth rate for the rest of the monetary union drops down to 2.8% in the third quarter from 3.4% in the second quarter and that compares to 3.8% in the first quarter.
The median growth rate, which is the growth rate among these eight countries and is unweighted, rises to 1.4% in the third quarter from 1% in the second quarter while the year-over-year growth rate has a median of 1.1% compared to 1.3% in the second quarter.
The quarter-to-quarter growth rates favor slightly the smaller countries in terms of the growth rate being logged although both large and small countries show a stepup in growth from the second quarter to the third quarter. Year-over-year growth rates also show much stronger growth in the rest of the monetary union compared to the four largest EMU economies on a consistent basis in fact for each of the four quarterly year-over-year growth rates in the table.
The rankings of growth give us some idea why we face these statistics, since three of the four largest monetary union economies log growth rates that are below their respective median growth rates since the late 1990s. Only three countries have growth rates above their medians on this timeline; those are Ireland, Portugal, and Spain. Germany, the largest monetary union economy, has a 30.4 percentile ranking for its year-on-year growth rate, France has a 28.3 percentile ranking, and Italy has a 35.9 percentile ranking.
The numbers posted today are in line with preliminary results and what markets had expected. Growth in the euro area continues to be positive and to move ahead. The signs in this report are that there's more progress than regress quarter-to-quarter although the progress remains slow, it's also relatively broad. This is a positive report but not a glowing report.

 Global