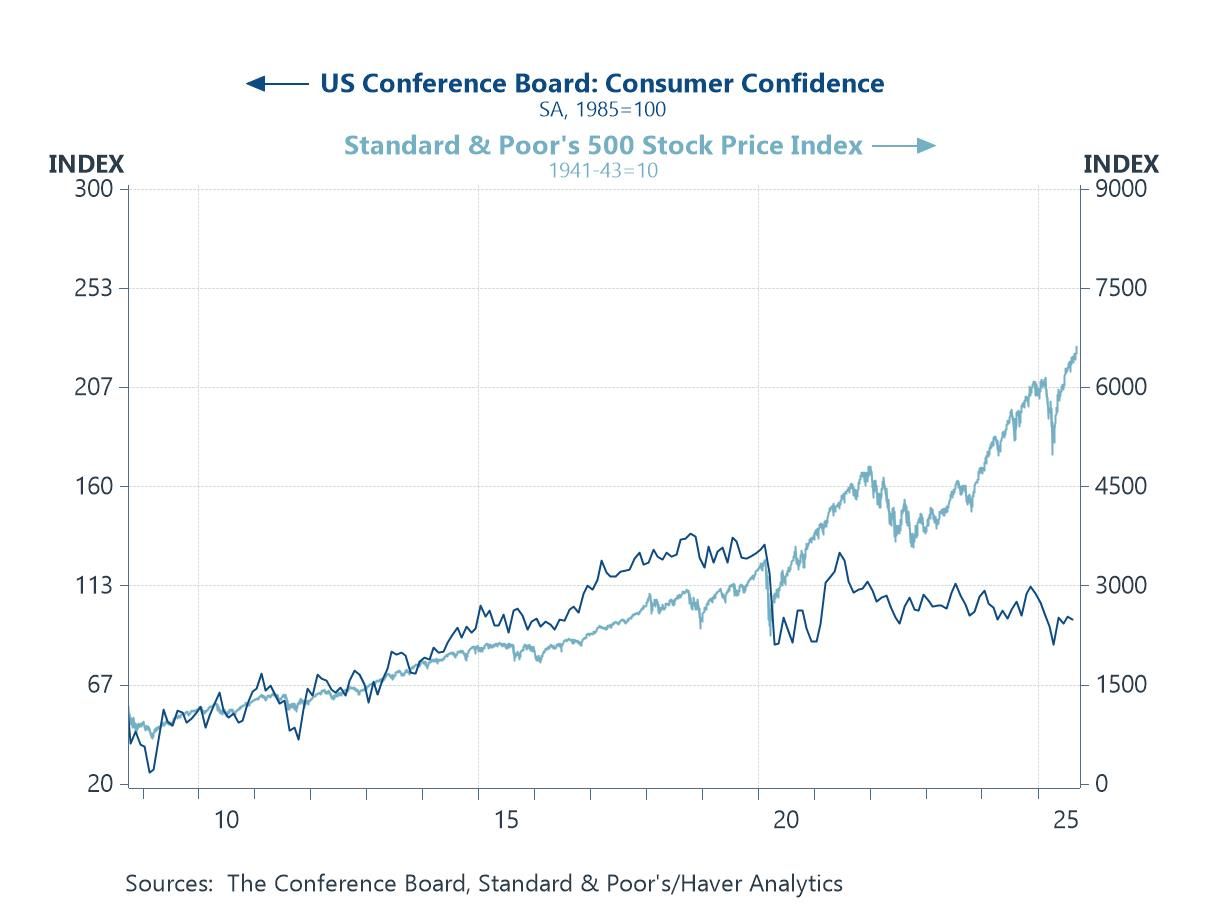
Global equity markets have remained near record highs over the past few days following the Fed’s 25bp cut on Wednesday, and which investors have seen as a key prop even without a full dovish pivot. AI optimism is also arguably doing some heavy lifting: markets are pricing a step-change in economy-wide productivity and margins from AI adoption, lifting multiples—especially among AI-exposed companies. However, some of this week’s charts frame the hurdles those hopes must clear: US consumer confidence remains subdued even as equities rise (chart 1); the Fed’s forward path is potentially becoming more politicised and inflation expectations have not softened in line with oil (chart 2); economists’ 2025 profit growth forecasts, in the meantime, have been marked lower and dispersion is wide, leaving valuations reliant on an AI-led earnings re-acceleration (chart 3). Elsewhere in Asia, earlier and ongoing easing underscores weak domestic demand and tariff risks rather than robust momentum (chart 4). Commodity dynamics could help at the margin—food prices have eased on better harvests and smoother supply chains (chart 5). Finally, and ahead of this week’s BoE decision in the UK, elevated services inflation tied to still-lofty pay growth is complicating the scope for further policy easing. In sum, the equity narrative arguably leans heavily on AI delivering tangible, near-term earnings power while policy remains credible and inflation contained; disappointment on any front in other words could challenge today’s valuations.
 Global| Sep 18 2025
Charts of the Week: Faith in the Fed, Faith in Fiber
by:Andrew Cates
|in:Economy in Brief
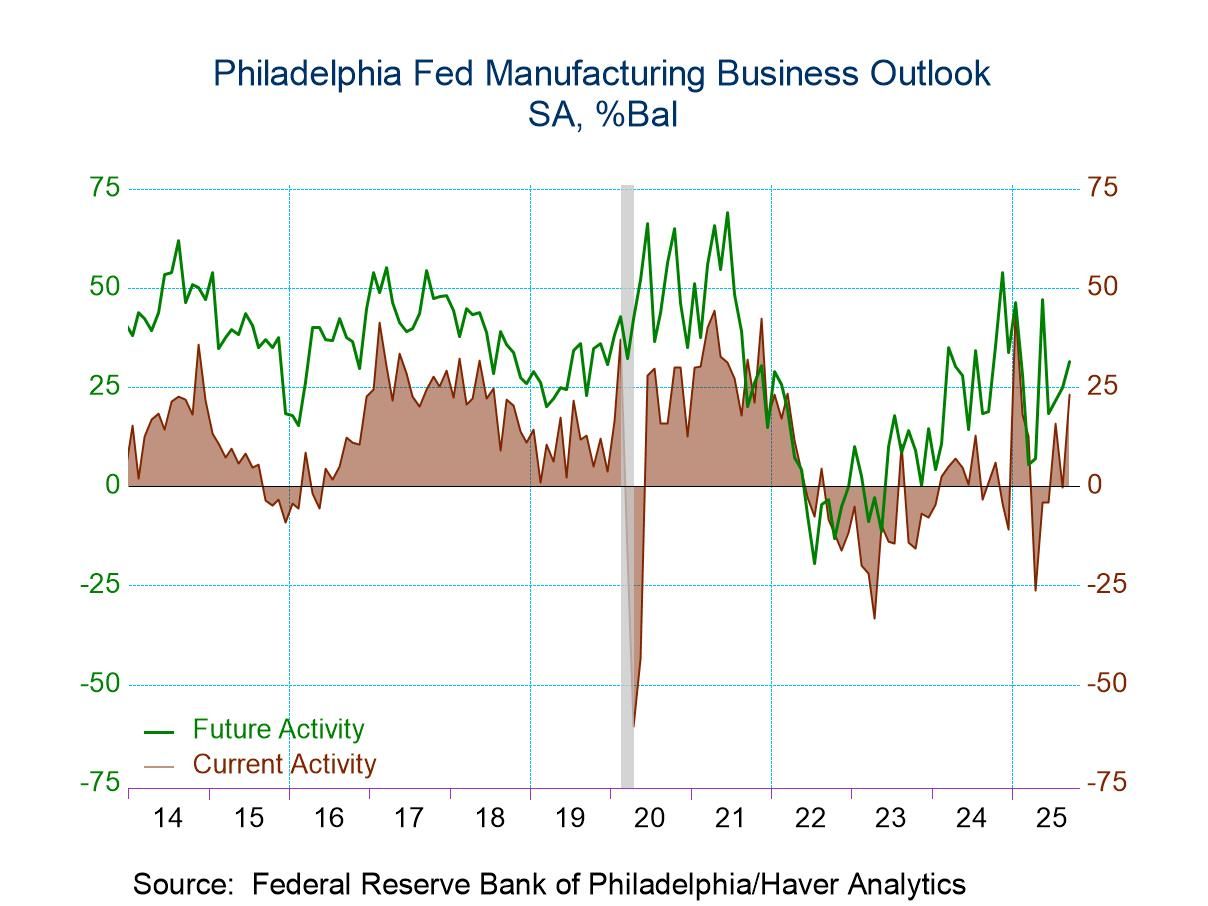
- Current General Activity Index improves to highest level since January.
- Inflation reading declines to seven-month low.
- Future General Activity Index continues upward movement.
by:Tom Moeller
|in:Economy in Brief
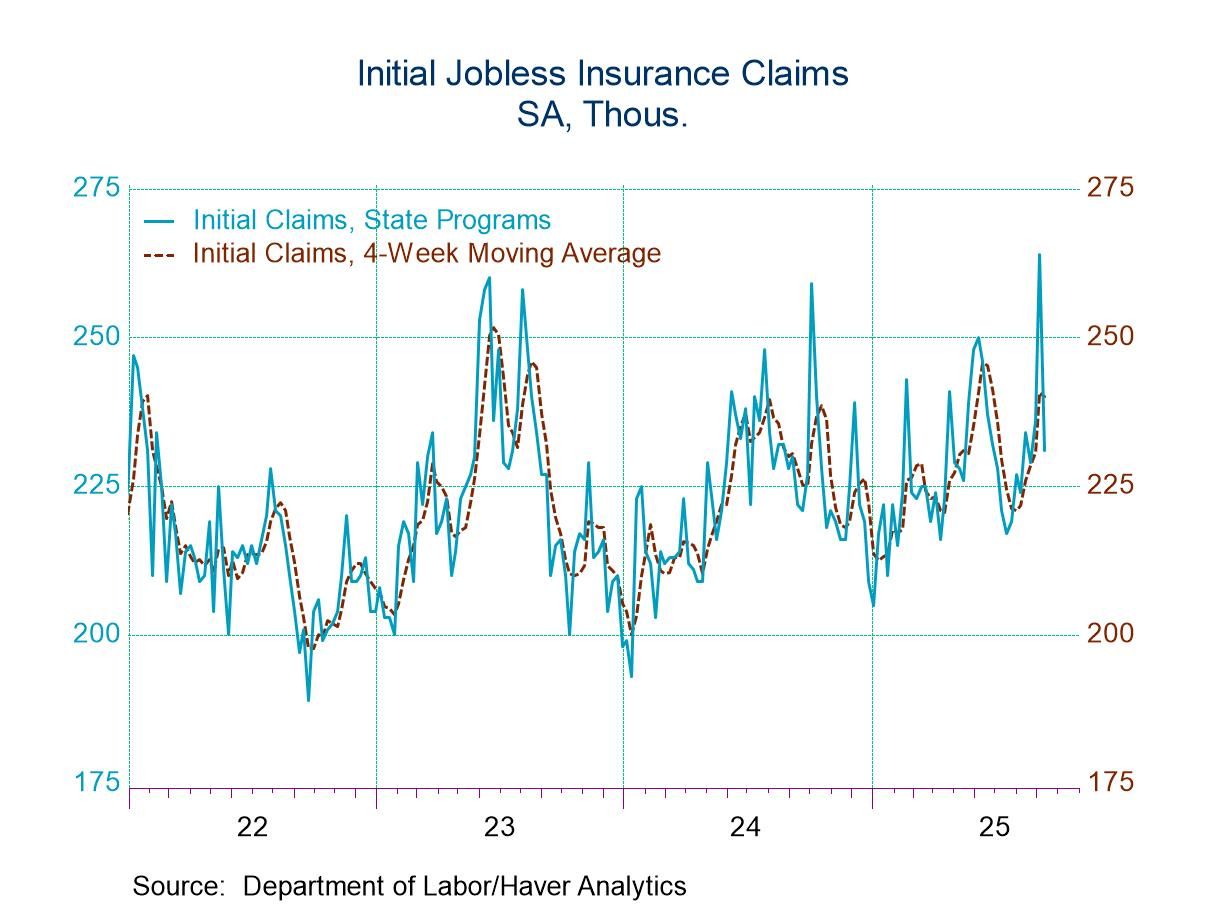
- Initial claims declined 33,000 in latest week.
- Continuing claims were down slightly.
- Insured unemployment rate holds steady.
 Australia| Sep 18 2025
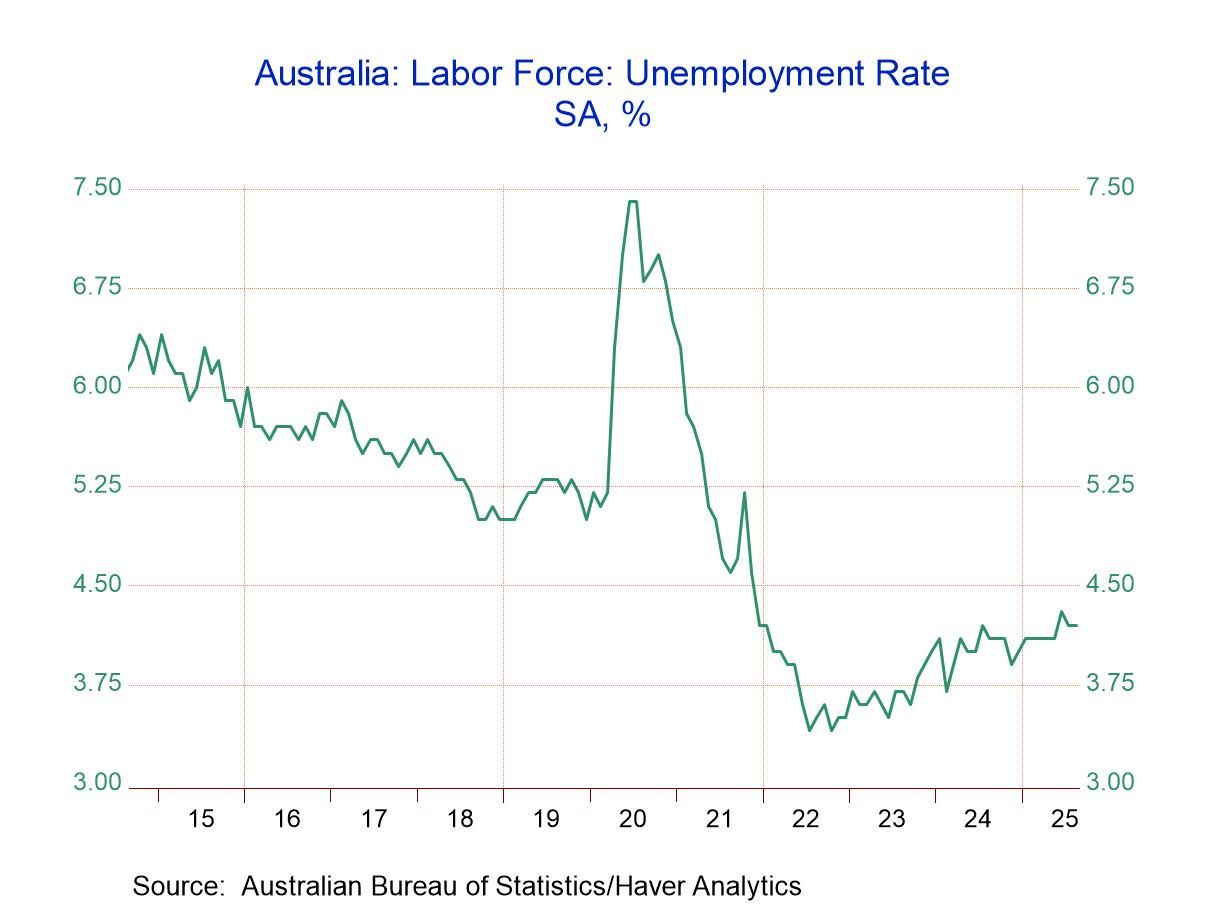
Australian Unemployment Steady and Low Despite a Broader Rising Trend
Unemployment in Australia in August remained low, standing at 4.2%, the level it dropped to in July. June brought a rise in unemployment to 4.3% after posting 4.1% in May. However, at 4.2% the unemployment rate in Australia is low, since about 2000 the unemployment rate has been lower only about 16% of the time.
The labor force participation rate in August fell to 66.8 from 67.0 where it had been for the previous several months. The participation rate, however, is high on historic comparison at about the 95th percentile; the participation from people ages 15 to 64 is even higher with a 97.7 percentile standing on the participation rate of 80.6%.
However, employment gains in Australia have been slowing. The year-over-year gain is 1.5%, over six months, employment speeded up, gaining a pace of 1.9% at an annual rate, but over three months the growth rate for employment has fallen to a sharply lower 0.6% annualized.
Australia's labor force fell by 0.5% in August after rising robustly in previous months. The labor force was rising by 1.6% over 12 months, at a 2.2% annual rate over six months and at a 1.3% annual rate over three months. There's been some variability in labor force growth, but it still seems to be relatively solid. The year-over-year growth rate, however, has a ranking only in its 33 percentiles historically back to the year 2000- a lower one-third standing.
In terms of the overall economy, retail sales have picked up; some of this is inflation. The growth rate for retail sales over three months is 7.1%; over 12 months it's 4.9%. Headline inflation grew by 2.8% over 12 months, but it's rising over three months at a stronger 4.2% annual rate. Inflation excluding volatile measures has been relatively stable over three months, six months, and 12 months. However, it picked up quite considerably in June, rising at a very rapid double-digit pace.
Australia's low and consistent unemployment rate is in step with what's going on internationally. Globally there is stability or some small backtracking on unemployment gains made since COVID. In the European Monetary Union, we're looking at unemployment rates consistently low over 12 months, 3 months, and 6 months at a historically low level. Japan's unemployment rates are consistent and low near historically low levels as well. In the United States and in the United Kingdom, unemployment rates are relatively stable. The U.K. shows some drift up in its unemployment rate. But both the U.S. and the U.K. have unemployment rates that have been lower only about 30% of the time.

- FOMC lowers funds rate target by quarter point after stability since December 2024.
- The decision was approved by all but one FOMC voter.
- Expected GDP growth & price expectations raised.
by:Tom Moeller
|in:Economy in Brief
 USA| Sep 17 2025
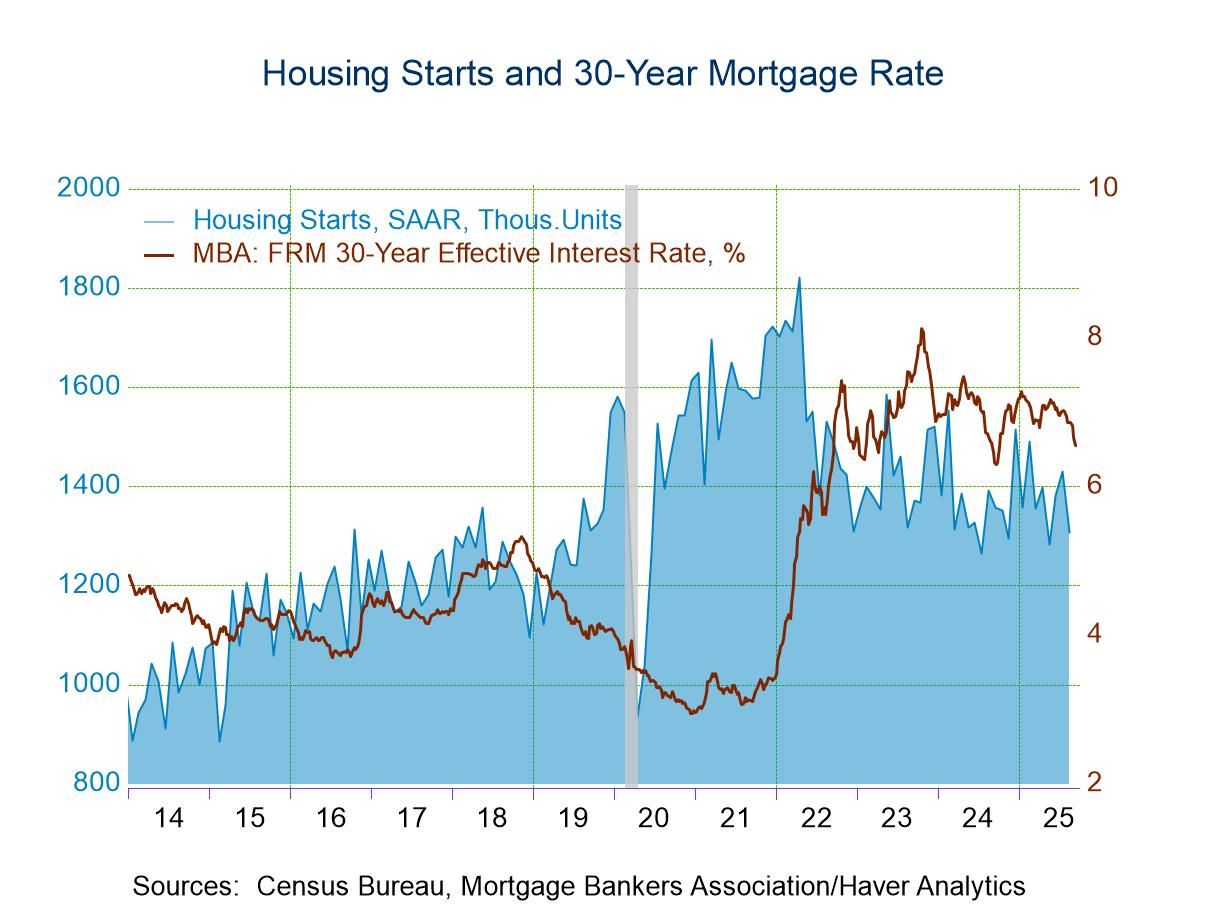
U.S. Housing Starts and Building Permits Decline in August
- Downturn reverses June/July improvement.
- Single & multi-family starts decline.
- Building permits drop to five-year low.
by:Tom Moeller
|in:Economy in Brief
 USA| Sep 17 2025
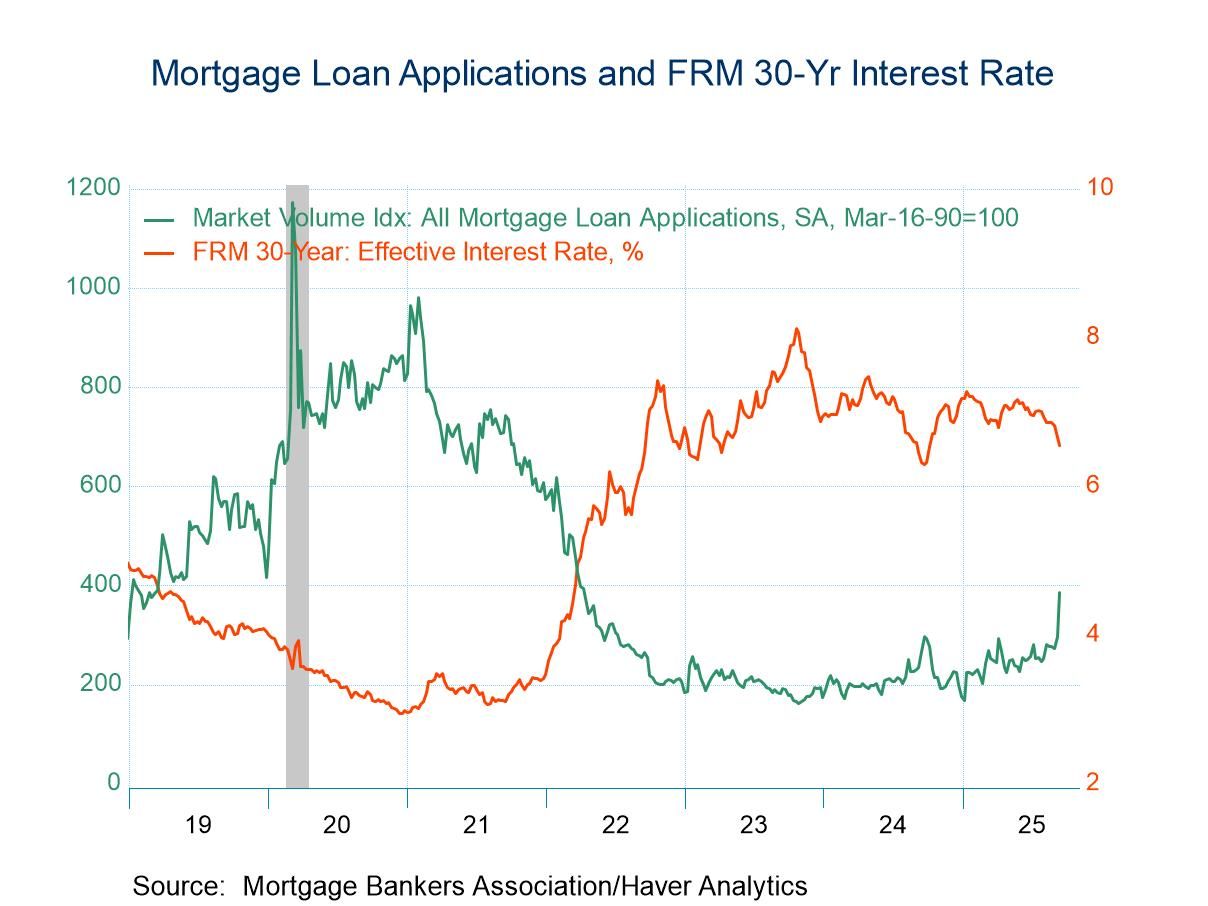
U.S. Mortgage Applications Surge 29.7% in the September 12 Week
- Purchase applications rise 2.9% w/w; revival of refinancing loan applications with a 57.7% w/w jump.
- Effective interest rate on 30-year fixed-rate loans falls to 6.55%, the lowest since October, 2024.
- Average loan size posts double-digit rise.
 United Kingdom| Sep 17 2025
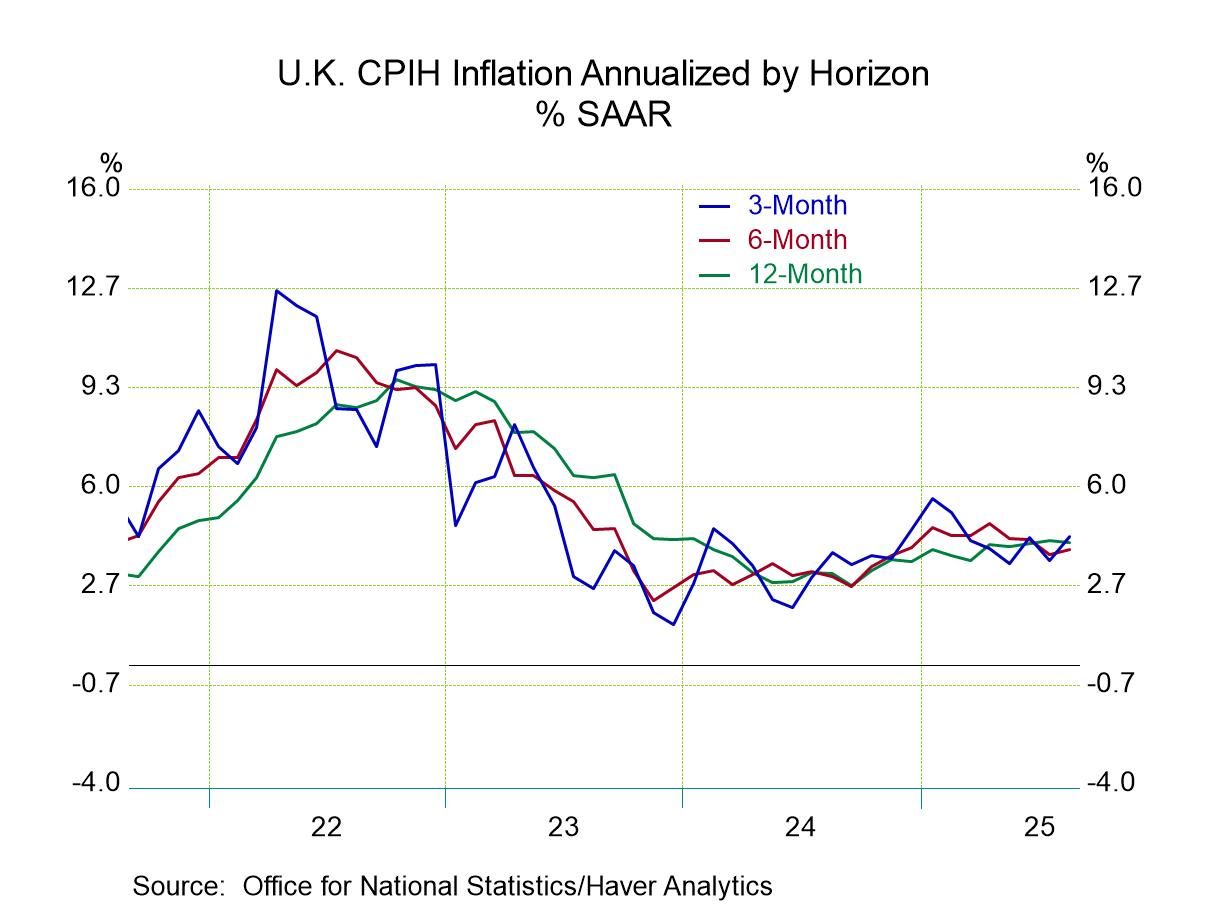
U.K. CPIH Inflation: Stable and Excessive
Inflation in the United Kingdom in August rose by 0.3% on the CPIH measure; excluding food, alcohol, energy, and tobacco (core), the increase was a milder 0.2%. Headline inflation in the U.K. runs at a 4.3% annual pace over three months; the core measure runs at a 3.6% annual rate pace, a bit weaker but still over the top of the U.K. 2% target.
Sequential trends: Sequential inflation in the U.K. is stubborn at 4.1% over 12 months, at a 3.9% annual rate over six months, and at 4.3% an annual rate over three months - a pace that is consistent, steady, and excessive. Core inflation runs at 4% over 12 months, edges down to a 3.6% annual rate over six months and stays at 3.6% over three months - still relatively steady and excessive but with a hint of progress.
Inflation monthly: In August among the 10 detailed categories, inflation accelerated in five of them, in July it also accelerated in five of them, and in June there was an acceleration in four of them. Diffusion calculations show that the tendency for inflation to accelerate across categories, the headline and core has been slightly below the 50% mark making inflation slightly disinflationary.
Sequential diffusion: Sequentially diffusion has been behaving better, with 12-month inflation higher than 12-month-ago inflation by a slight margin with the diffusion reading of 54.5%. However, over 6 months comparing inflation to 12-months across categories, diffusion is only 45.5%, and over 3 months comparing inflation to inflation over 6 months, the diffusion calculation steps down to 36.4%. When diffusion is above 50%, inflation is accelerating in more categories than it is decelerating; when it's below 50%, inflation is showing more deceleration than it is acceleration. These diffusion calculations are encouraging, although they are only indications of breadth not of importance because they just compare across categories and they are executed without weighting. The headline and the core measures bring weighting into play, and we see the impact of that by comparing those measures sequentially. Still, diffusion is an interesting measure on its own because it helps to show how widespread pressures are.
U.K. unemployment- At the same time, that inflation has been stubborn. The unemployment rate in the U.K. has gradually been creeping up. The U.K. claimant rate of unemployment, which is just a little bit more topical, has been slightly more stable sequentially than the overall unemployment rate and in June and July that rate of unemployment gauge edged slightly lower. However, it's a different concept than for overall unemployment although the two readings are similar in terms of their levels when ranked over the same. They're very different with the unemployment ranking through June 2025 at 34.5% while the June claimant unemployment rate ranking is high relative to its historic experience at its 75.3 percentile - much higher.
- of2728Go to 68 page