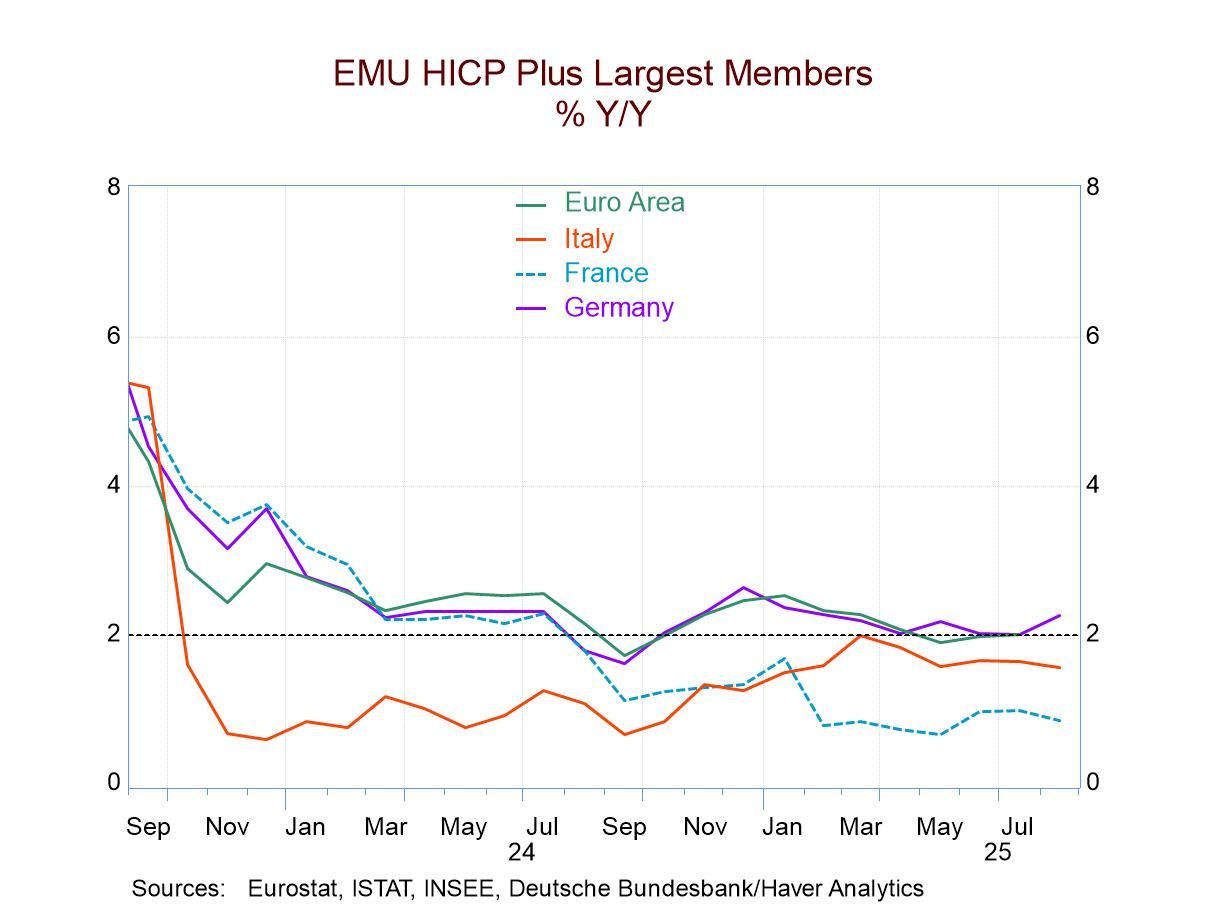
Haver Analytics
Haver Analytics

Economy in Brief

  • The Cabinet Office: General business conditions Japan's Cabinet Office survey of general business conditions shows a diffusion reading of +2 in the first quarter of 2025 compared to a net of +5.7 last quarter. This is the reading for all big companies. The reading for large manufacturers slipped to -2.4 from +6.3, a much sharper drop. Unfortunately, manufacturing is often looked upon as the harbinger for future developments in the economy. Non-manufacturers show their reading slip as well, to +4.1 from +5.4 in the first quarter of 2025 compared to the fourth quarter of last year.

    Smaller company results- Medium-sized manufacturing companies, posted a decline in the fourth quarter and a bigger decline than this first quarter, logging a reading of -1.5 at the end of last year and the reading of -6.9 in the current quarter. Small manufacturing companies continue to post negative results, and they also saw substantial slippage, falling from a -12.4 reading in the fourth quarter to a -18.3 reading in the first quarter of 2025.

    Rankings In the table, I include rank standings for these readings on data that are back to 2004, an approximate 20-year horizon. The overall reading for large companies has a 54.8 percentile standing, which is above its historic median for that timeline. However, large manufacturing companies have a standing only at their 38.1 percentile. Medium-sized manufacturers have a reading at their 34.9 percentile, not too different from large manufacturing enterprises. Small manufacturers, despite their much-weaker negative reading in the first quarter, show a queue percentile standing in their 44.6 percentile. They chronically pose weaker numbers than their larger counterparts; therefore, when ranked relative to their own history, their current weaker diffusion readings don't seem to be quite as weak on a ranking basis. However, none of this puts too much positive spin on the data for the quarter.

    General domestic conditions The readings for general business conditions show even a higher percentage of readings that are below their 50th percentile which puts them below their median ranking. The reading for all large companies decreased to 3.1 in the first quarter of 2025 from 4.2 at the end of last year. Large manufacturers slipped from +2 at the end of the year to -1.3 in the current quarter; medium-sized manufacturers slipped to -8.7 in the current quarter from -3.8 in the fourth quarter of last year while small manufacturers slipped to -22.8 from -20.9. The standings show the reading for all big companies at a 45.8 percentile standing; the standing for large manufacturers at 33.7 percentile; the standing for medium-sized manufacturers had a 34.1 percentile standing and for small manufacturers there is a 43.9 percentile standing.

    Number of employees The readings for the number of employees conversely improved for large companies, moving to 28.3 in the first quarter of 2025 from 27.4 at the end of the year; for large manufacturers there is an improvement as well to 20 in 2025-Q1 from 19 in the fourth quarter. Medium-sized manufacturers see slight slippage to 32.7 from 33.3 at the end of the year, and small manufacturers see a slippage as well to 21.7 from 24.4 at the end of the year. Large companies and large manufacturers are improving while the smaller firms are falling behind. However, there's a proliferation of rankings for these results in the 90th percentile in fact, in the high 90th percentiles. For all big companies, there's a 98-percentile standing, the same as for large manufacturers. Medium-sized manufacturing companies have an 89.3 percentile standing and small manufacturers have a 79.8 percentile standing. None of these are weak or disappointing readings.

    Quarters ahead... Beyond the current quarter, there are also readings in the table for the next quarter and the second quarter ahead. I provide only rankings for these readings and what we see is that for the quarter ahead conditions for large firms and large manufacturers are generally weakening and weakening significantly comparing the queue percentile standings in the current quarter to the standings for the next quarter ahead. However, for the second quarter ahead, there's generally a bounce back from the weakness in the quarter ahead, but that bounce back still does not take the ranking readings back to the levels achieved in the first quarter. For the most part, this is not particularly impressive result. The cabinet report retains a downcast view of the futures as well as a weak – and weakening- assessment of current economic performance. This deteriorated view is not as widespread as it might have been since it seems to have bypassed at least a piece of the job market where readings remain firm to strong in historic comparison.

    • Job openings rise during January following a lessened December decline.
    • Increase is concentrated in retail trade & financial industries.
    • Hiring improves but separations increase.
    • Feb. NFIB Small Business Optimism Index down 2.1 pts. to 100.7; second consecutive m/m decline following four straight m/m rises.
    • Uncertainty Index up 4 pts. to 104, the second highest reading.
    • Expectations for economy down 10 pts. to 37%, the lowest since November.
    • Expected real sales down 6 pts. to 14%, a three-month low.
    • Net percent of firms raising avg. selling prices up 10 pts. to 32%, the biggest m/m increase since Apr. ’21 and the highest reading since May '23.
    • Quality of labor (19%) and inflation (16%) are top business concerns.
    • Gasoline prices ease.
    • Crude oil prices decline.
    • Natural gas costs rebound.
  • Japan's GDP growth has picked up rising by 2.2% in the fourth quarter at an annual rate and rising 1.2% in the fourth quarter over the 4th quarter of one year ago. The 1.2% year-over-year growth rate in GDP is the strongest since the second quarter of 2023, six quarters ago. The chart showed that both measures- both the year-over-year and the annualized quarter-to-quarter results, for Japan's GDP are signaling an ongoing revival in growth after a more difficult period from mid-2023 to early-2024.

    Consumption- Private consumption spending in Japan rose by only 0.1% quarter-to-quarter but it's rising by 1.1% year-over-year; the year-over-year gain was last stronger in the first quarter of 2023. Public consumption in Japan rose by 1.6% at an annualized quarter-to-quarter rate, at almost the same pace, at 1.7% in year-over-year terms. The 1.7% year-over-year pace is strong, the strongest since the first quarter of 2022, again, in terms of year-over-year public sector consumption spending.

    Fixed capital- Gross fixed capital formation rose by 0.9% in the quarter at an annual rate, reversing a decline of the same magnitude one quarter ago. Capital spending generally has been higher than this in the preceding quarters.

    Plant & Equipment- Spending on plant & equipment rose by 2.3% annualized in the quarter; its rise year-over-year in the fourth quarter is 1.2%. That 1.2% rise is one of the weaker increases recently. This is the weakest result in the last four-quarters in plant and equipment spending. While consumption seems to have come online, fixed investment and plant & equipment capital spending definitely are lagging behind the consumer sector.

    Housing- Spending on housing fell by 0.8% at an annual rate in the fourth quarter compared to 1.8% annual rate gain in the third quarter. The Q4 year-over-year change in housing spending is -1.2%; for this particular series there are negative year-over-year numbers for the last four-quarters. However, the -1.2% year-over-year rate on the fourth quarter of 2024 is the ‘least weak’ of the last four quarters in terms of year-on-year growth rates, so there may be some signal of progress buried in these numbers on housing.

    International Sector- The quarter-to-quarter change in Japan's real net export numbers move into positive territory in the fourth quarter after four previous quarters of negative numbers. Turning to year-over-year changes in Japanese net exports, they remain negative in the fourth quarter, the third consecutive negative year-over-year change in a row by quarter. However, it's the smallest negative change of the last three quarters so this period of net export deterioration may be coming to a close, which is what the strong quarter-to-quarter reading implies. Looked at separately, export growth has been slowing down; the annualized quarterly rate had logged a -15.5% annual rate in the first quarter of 2024 accelerated to 6.8% at an annualized quarterly rate in Q2, softened to a 6.1% annual rate gain in Q3 and now, in the fourth quarter, it logs an even weaker 4.1% annualized rate quarter-to-quarter. The year-over-year export growth figures turn negative in the fourth quarter to -0.1% and this is the first negative growth rate for exports year-over-year since the fourth quarter of 2020. On the import side, imports fall by 8.3% at an annual rate quarter-to-quarter after rising 8.1% at an annualized rate in the third quarter. Imports also fall by 0.1% year-over-year at end 2024; the last time import numbers were negative year-over-year was in the first quarter of 2024. So, this is not such a watershed for weakness. But weakness in imports suggests that GDP may not be doing as well as the aggregate number suggests because we'd expect with strong GDP to have stronger imports in place.

    Summing up- In fact, the weak import numbers are in some way also inconsistent with domestic demand. Year-over-year domestic demand rises by 1.1%, a bit weaker than it posted in the third quarter of 2024, but still the number that is quite solid by recent experience. I’d expect to see either Japan’s imports pick up, or GDP to cool. Since GDP seems to be in an early acceleration phase, Japan is probably going to see imports step up.

    • Metals prices lead the increase.
    • Lumber prices strengthen.
    • Crude oil prices decline sharply.
    • Underlying trend remained moderate.
    • Measures of stress have deteriorated, but not to alarming levels.
  • German IP is on the brink of a sea-change with the new German focus on rearming and increased military spending. Still, that is in planned-policy; it will take a while for it to be reflected in actual economic performance and in economic data. For now, the trend tells us what is in train, but we should expect a marked improvement IN TREND in the future.

    The sector trends year-over-year show that the declining way of output still mostly holds sway, but that year-over-year output declines have been getting smaller and smaller. Consumer goods output growth is now showing positive growth year-over-year.

    Monthly growth rates Monthly IP growth rates by sector are all positive in January, a sharp contrast with December when output fell sharply across sectors, except output of consumer goods. Manufacturing orders show drops in January and November with a rise in December sandwiched in between.

    Sequential German growth rates German IP is showing accelerating growth rates from 12-months to 6-months to 3-months overall and for all sectors except for capital goods, where output is back-tracking at a 2% annual rate over three months. Real sales are also accelerating sequentially, but real orders show strong deceleration. Normally this would be a situation of a coming grim reality since orders lead sales and output. But since we know military spending is going to become stimulative, we have a reasonable expectation that the weakness in orders will fail in this case to be a harbinger for future output and sales.

    German indicators German indicators show mostly improvement month-to-month; the IFO manufacturing expectations series is the exception in January. And sequentially the industrial surveys are still on weakening trends: the ZEW current, IFO for manufacturing, IFO manufacturing expectations, and EU Commission industrial index.

    Other Europe Other European economics in the EMU offer an array of experiences for industrial production performance and trends in January. Among the six early reporters in the EMU for other Europe in the table, three show output increases in January, three also in December, and three in November. Their sequential performances in terms of growth rates over 12 months to 6 months to 3 months show France and Spain logging declines on all three horizons. The Netherlands shows increases on all horizons. Three countries show persistent deceleration: France, Spain, and Ireland. The Netherlands shows persisting acceleration. Two non-EMU reporters, Sweden and Norway, also show persistent acceleration.