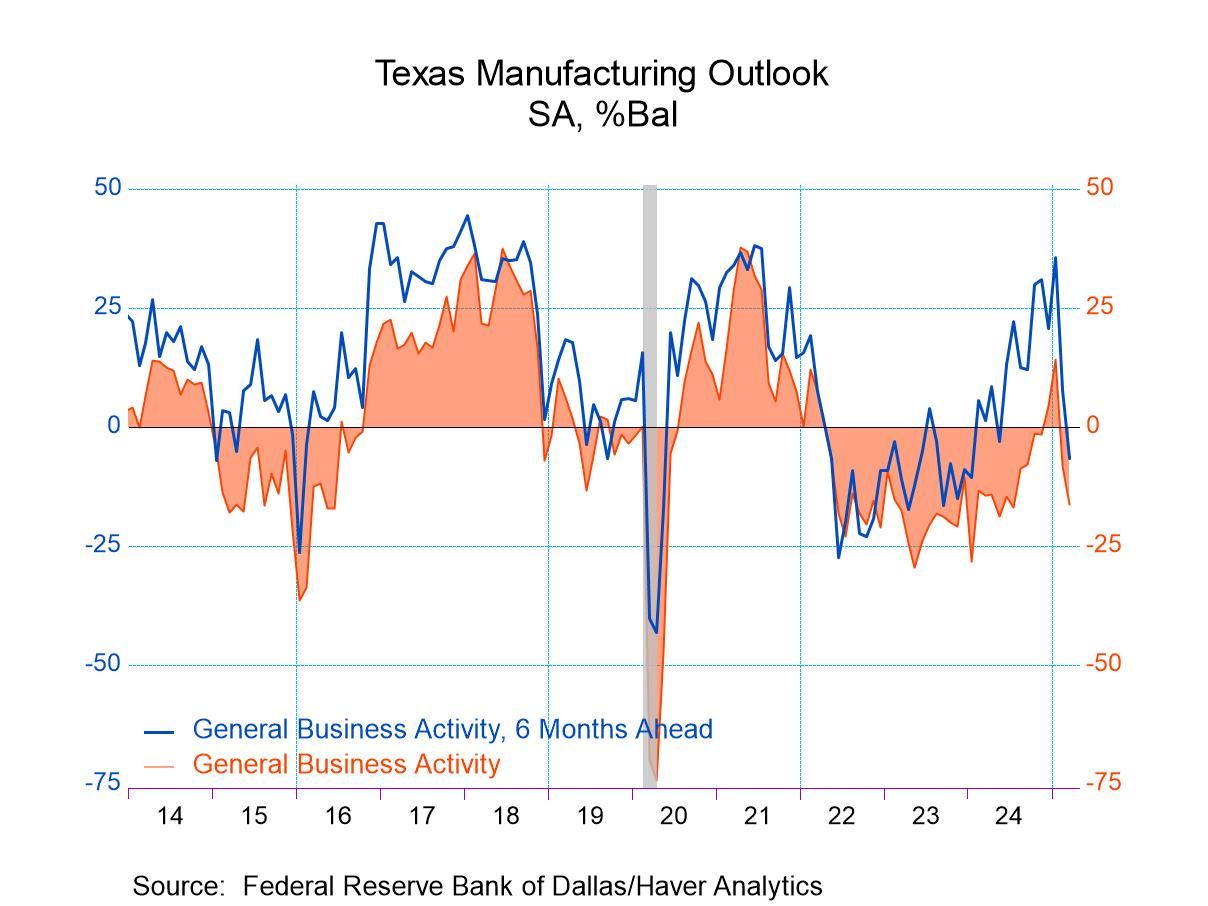
- General business activity index falls to 10-month low.
- New orders growth & labor market readings remain negative.
- Production & shipments improve.
- Future business index turns decisively negative.
by:Tom Moeller
|in:Economy in Brief
 Europe| Mar 31 2025
Some Hopeful Signs in European Inflation Trends; But Are the Signals Good Enough Given the Circumstances?
The Circumstances- The chart of the three largest EMU economies and their HICP inflation rates shows clearly that year-over-year trends and inflation in France have broken lower while Italy, that has long had the lowest inflation rate in the monetary union among the four largest economies, is on a mild uptrend. Germany has made a very small re-set as inflation has broken lower in the short-run, but German inflation year-on-year actually would still appear to be in a slight uptrend.
There is good news- Despite these broader views, there is some excitement over this month’s inflation statistics from Germany. German inflation has fallen by 0.2% in March after rising by only 0.1% in February and in January. The annual rate change for inflation in Germany over three months is -0.3% which compares to France at -2.1%. These are clearly good inflation developments for the two largest economies in the monetary union; however, Italian inflation over this period is at a 5.7% annual rate while Spain's inflation is at a 1.2% annual rate. Among the four largest monetary union economies, three of them have short-term inflation rates well inside of the ECB's targeted pace for the union as a whole; however, the picture is far from completely clear.
There are reasons to be cautions in digesting the ‘good news’ - Italy shows a clear acceleration for inflation from 2.2% over 12 months to 2.8% over 6 months to a pace of 5.7% over 3 months; that acceleration is uncomfortable. For Germany, the year-over-year inflation is in excess of the EMU-wide target at 2.5%, and still excessive at 2.6%, and accelerating slightly over six months, but then it breaks sharply lower over 3 months to that -0.3% pace. France has relatively clean results with a one way read on inflation. Over all horizons, inflation’s pace is below the 2% mark and decelerating to boot running at a 0.9% annual rate over 12 months, followed with a 0.2% annual rate over 6 months, and then clocking -2.1% at an annual rate over 3 months. Spain is a good example of the mixed situation for European inflation as over 12 months it's 2.3% pace is slightly above the 2% that the ECB seeks for its EMU-wide target; over six months Spanish inflation steps up to a 3.4% annual rate, clearly excessive on everyone's radar, but not really worrisome, then, over 3 months, Spanish inflation settles down to only 1.2% at an annual rate- highly copacetic.
The inflation overview: numbers and their trends- Summing up what we have here are three countries with 12-month inflation above the 2% pace. France is below it at 0.9%. We also have three countries with inflation above the 2% pace over 6 months with France as the exception again at only 0.2% over 6 months. In addition to that, two of the three countries show acceleration over 12 months compared to 12-months ago, and over 6 months compared to the 12-month pace, inflation accelerates in three of these four countries. It's possible to look at these data and find good news; however, it's also possible to look at these data and find that the news does not appear to be quite so good.
Beyond the headlines- Turning to the core inflation rates for Italy and Spain, we see that both of the core rates for those two countries are at 2% over 12 months within the ECB's desired parameters and a green light for any pending rate cut decisions. Italian core inflation runs at 1.9% over 6 months with Spanish core inflation at 1.7% over 6 months also acceptable paces to the ECB. Over 3 months the Italian core picks up to 2.4% annual rate while the Spanish score remains at 1.4% and as part of a decelerating process for Spanish core inflation from 12-months to 6-months to 3-months.

- Monthly core price gain is strongest since January 2024; annual rise edges up.
- Real spending rose last month after sharp decline.
- Disposable income surges and savings rate strengthens.
by:Tom Moeller
|in:Economy in Brief
 Europe| Mar 28 2025
EU Indexes Show Slight Erosion
The EU commission's overall reading for the European Monetary Area unexpectedly eroded, dropping to 95.2 in March from 96.3 in February, leaving it also below its January 2025 level but above its December 2024 level. It may simply be too soon for this survey to reflect any of the changes going on in Europe. But very clearly a ramp up in military spending is planned and economic conditions in the monetary union and beyond are about to receive a significant boost. While that development might be simply too new to have gotten into the indexes as of March, it is still in train so curb your disappointment.
EMU in March by Sector March readings for the monetary union show the industrial sector unchanged at -11 from February but showing improvement compared to both the December and January readings. Consumer confidence slipped in March to -14.5 from -13.6 in February and it's below its January and December levels as well. Retailing slipped to -7 in March from -5 in February and it also is below its string of readings since December of last year. Construction spending at -3 posted the same reading it logged in February and in January and those were slight improvements from December. The services reading in March slipped to +2 from +5 in February and it is also below its reading of +6 in January.
Country Readings Country level data show readings for 18 of the monetary union members; of these 18, only 6 have percentile standings for overall indexes that are above their median (a ranking of 50%) calculated on data back to 1990. Only one of the four largest countries has a reading above its median and that's Spain at a standing at 51.4% Other large countries show much weaker readings with Germany at a 16-percentile standing, Italy at a 37-percentile standing, and France at a 37.5 percentile standing. Month-to-month changes show deterioration in nine of the 18 reporting countries. This compares to a deterioration in eight in February and compares to January when six weakened relative to December. It is a worsening trend but based on developments in military spending to shore up NATO. Europe supported defense systems must carry more of the load. This will imply stimulus across the board coming for the monetary union.

 Global| Mar 27 2025
Charts of the Week: Tariffs, Tensions, and Trade-Offs
Financial markets remain gripped by heightened uncertainty surrounding US trade policy, slowing US growth, and broader fears of global economic instability. Latest data suggest that the recent introduction of US tariffs has driven up manufacturing input prices and risks exacerbating supply chain frictions (charts 1 and 2). Looking ahead, investors are also increasingly assessing the implications of reduced global cooperation for US capital markets and the value of the dollar (chart 3). Still, notwithstanding recent concerns, there remain big question marks about the degree to which other major economies, including Europe and China, will act as a magnet for global capital in the period ahead. Energy costs, for example, remain a critical ingredient for economic competitiveness, and while the US continues to benefit from low electricity prices, Europe’s high energy costs are still acting as a drag on its growth prospects (charts 4 and 5). As for China, tentative signs of stabilization have emerged following recent fiscal loosening and targeted stimulus measures, which have helped buoy industrial output and credit growth. The government’s latest initiatives—centred on infrastructure investment, tax incentives, and efforts to support the property sector—have raised hopes of a turnaround, though structural headwinds, including weak consumer confidence and ongoing financial strains in the real estate sector, remain formidable. Whether China can sustain a more durable recovery will be a key factor shaping global capital flows, particularly as investors weigh the relative attractiveness of US and Chinese assets in an increasingly fragmented global economy (chart 6).
by:Andrew Cates
|in:Economy in Brief
 USA| Mar 27 2025
U.S. Pending Home Sales Increase in February
- Sales edge up from record low.
- Pattern of home sales is mixed across country.
by:Tom Moeller
|in:Economy in Brief

- Inventory drag on economic growth remains largest in almost two years; net exports add negligibly to growth.
- Sharp gain in consumer spending growth is revised down slightly, while the decline in business investment is lessened.
- Price index gain is revised down slightly.
by:Tom Moeller
|in:Economy in Brief

- The headline index increased to -2 in March from -5 in February.
- The index has not been positive, depicting growth, since September 2022.
- New orders fell more rapidly while shipments fell less rapidly.
- Employment continued to decline though at a slower rate than in February.
- Prices paid for inputs surged to highest reading since September 2022.
by:Sandy Batten
|in:Economy in Brief
- of2693Go to 85 page