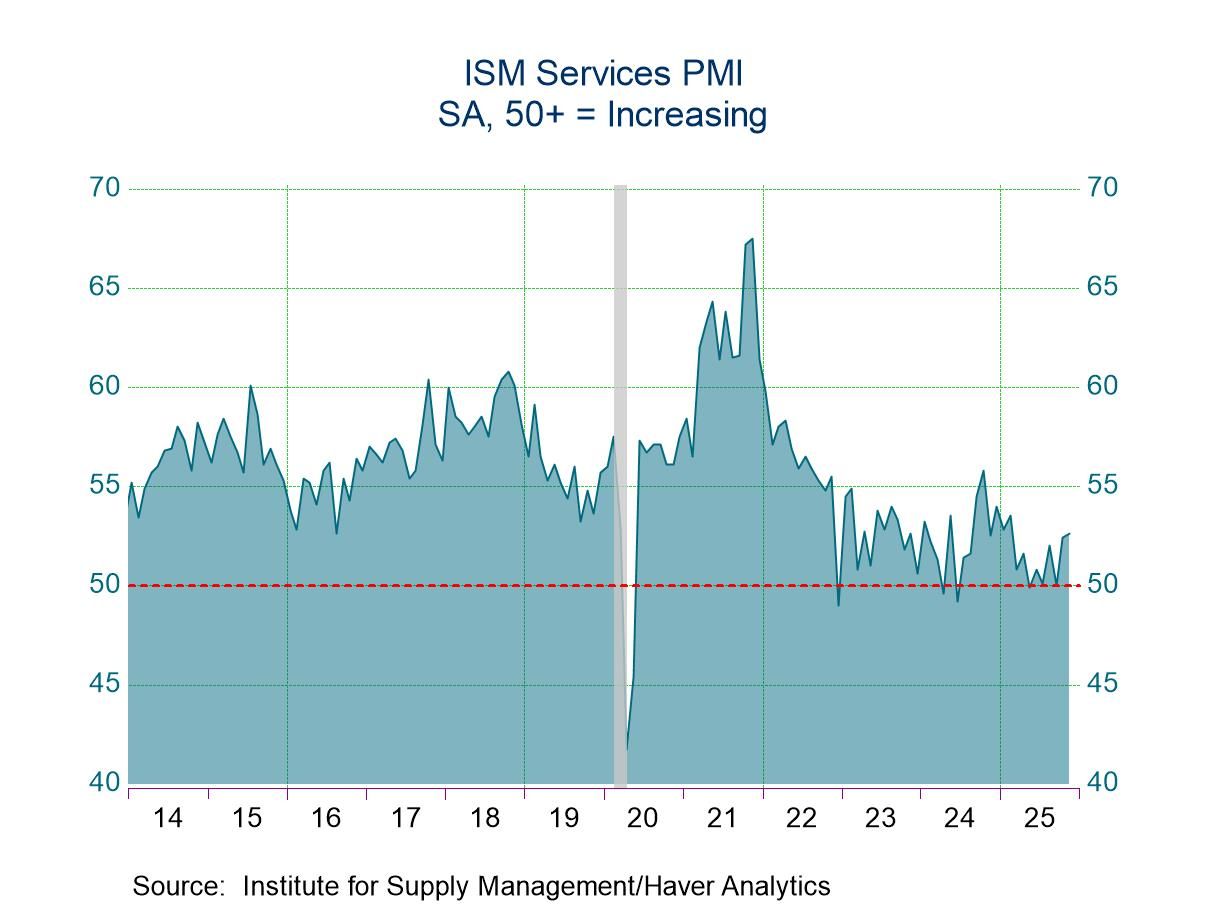
- Total services index is highest in nine months.
- Business activity, employment & supplier deliveries increase.
- Prices index declines sharply.
by:Tom Moeller
|in:Economy in Brief
 USA| Dec 03 2025
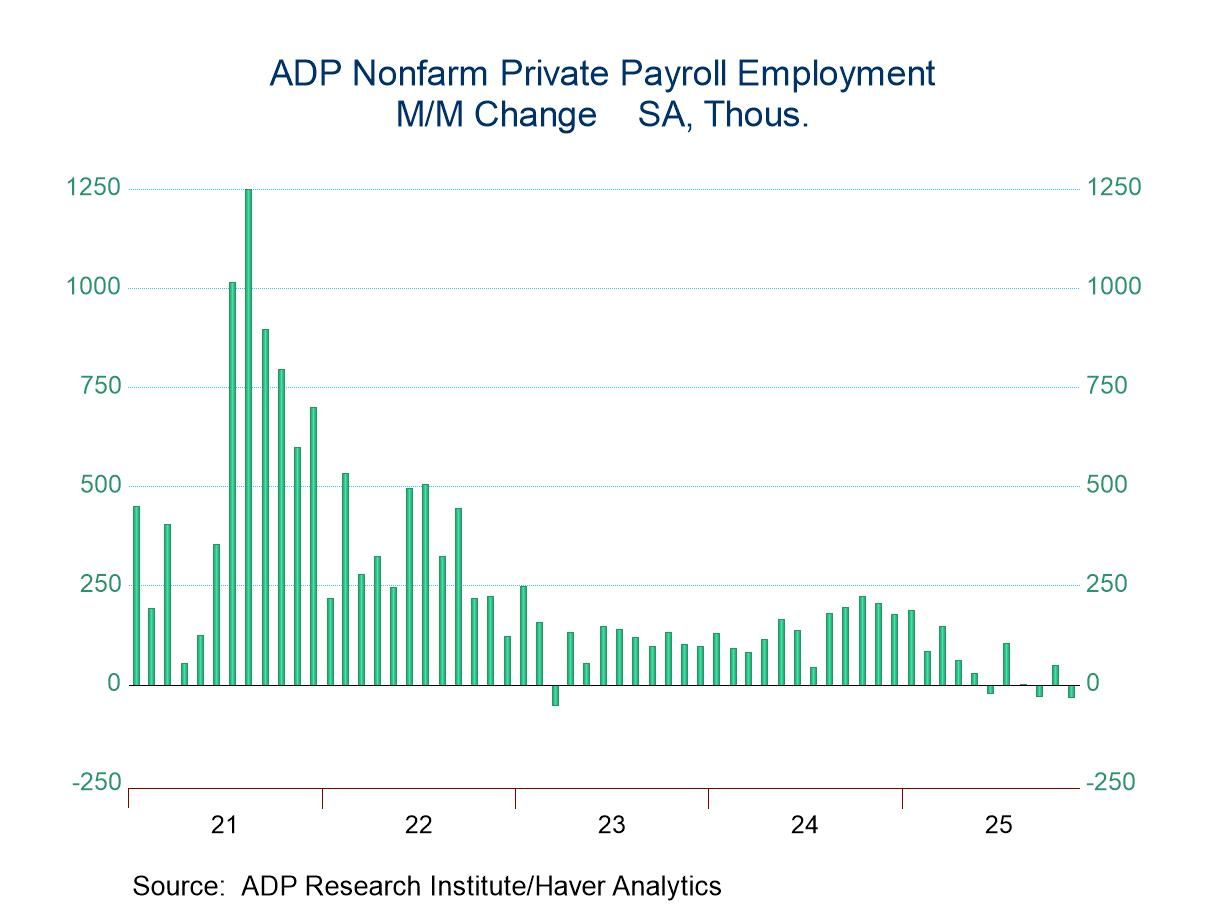
U.S. ADP Employment Declines in November
- Drop in private payrolls is third in four months.
- Hiring shortfall is led by small business.
- Both service-sector & factory jobs decline.
- Wage growth decelerates.
by:Tom Moeller
|in:Economy in Brief
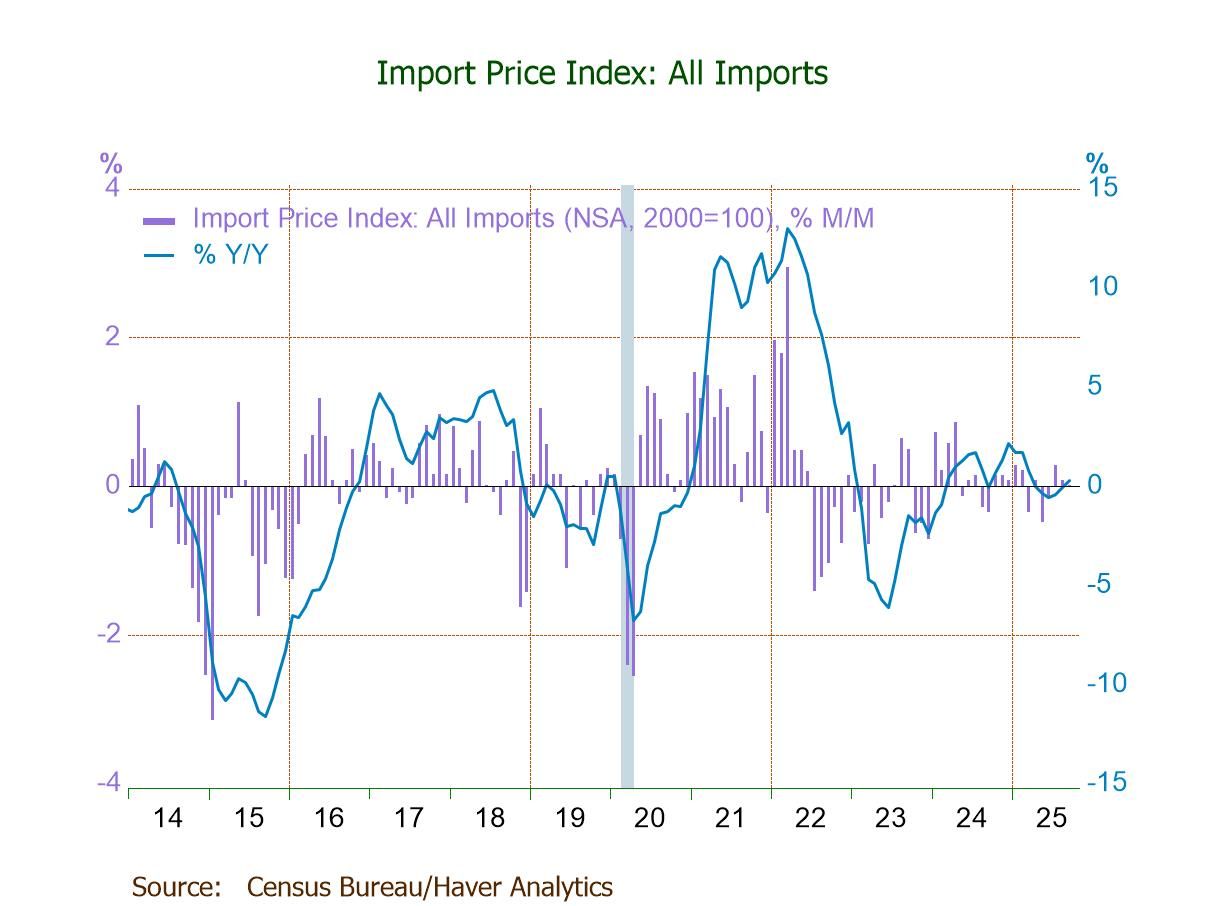
- Import prices unchanged (+0.3% y/y) in Sept. after two straight m/m rises, largely due to a 1.5% drop in fuel import prices.
- Excluding fuels, import prices up 0.2% (0.8% y/y), the third straight m/m increase.
- Export prices unchanged (+3.8% y/y), reflecting a 0.3% rebound in agricultural exp. prices and no change in nonag exp. prices.
 USA| Dec 03 2025
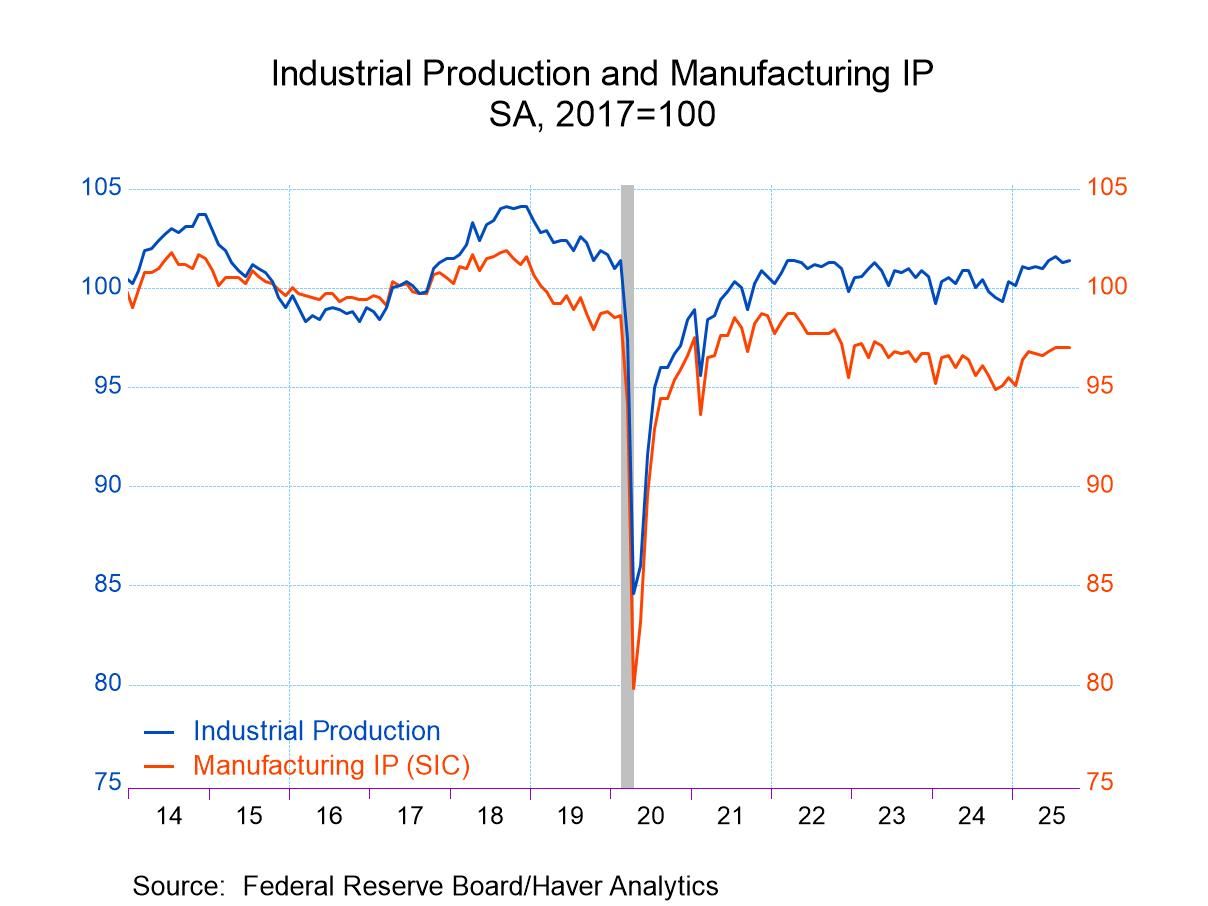
U.S. Industrial Production Edged Up in September
- IP edged up 0.1% m/m in September with a downward revision to August.
- Manufacturing and mining production were unchanged.
- Utilities output rebounded 1.1% m/m.
- Capacity utilization unchanged.
by:Sandy Batten
|in:Economy in Brief
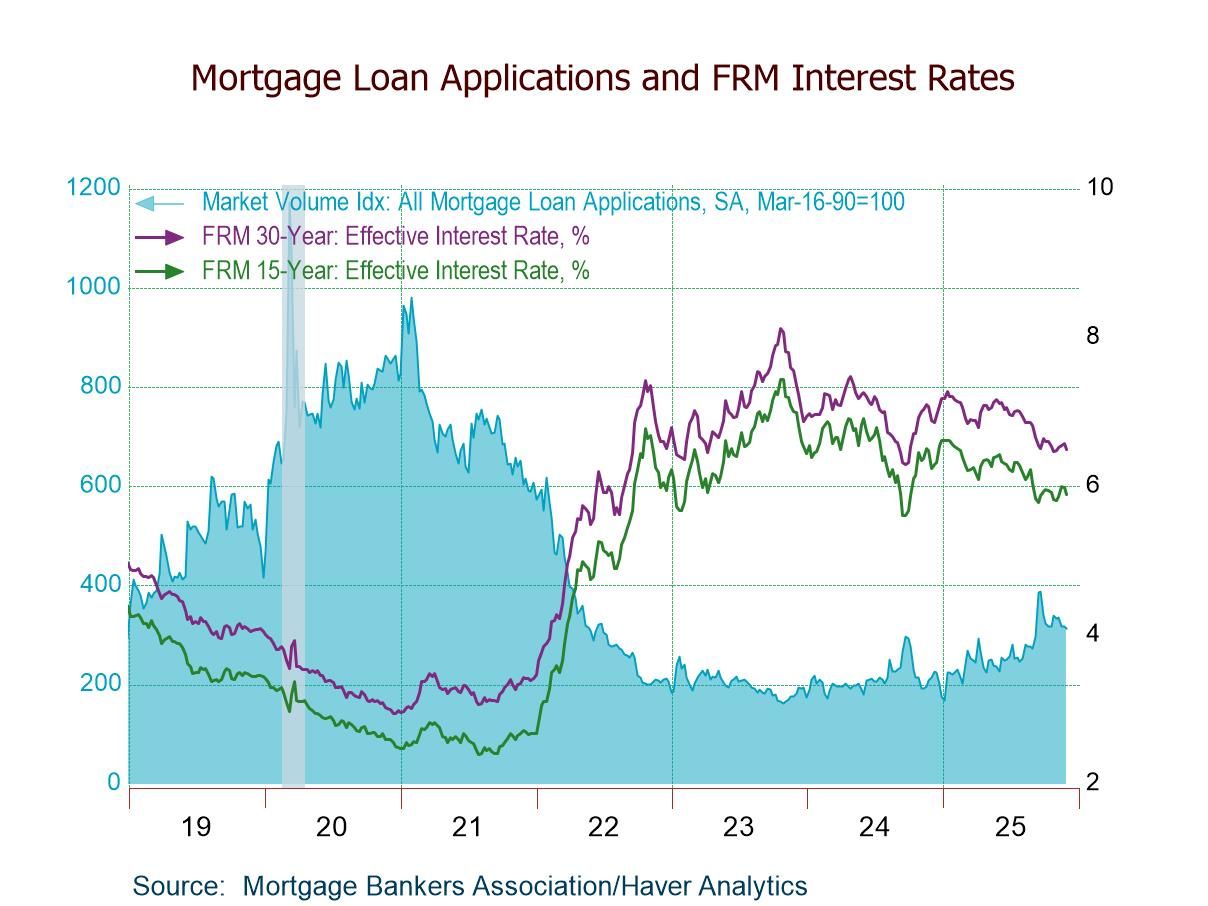
- Purchase applications +2.5% w/w; refinancing loan applications -4.4% w/w.
- Effective interest rate on 30-year fixed loans drops to a four-week-low 6.49%
- Average loan size rises to the highest level since the October 31 week.
 USA| Dec 02 2025
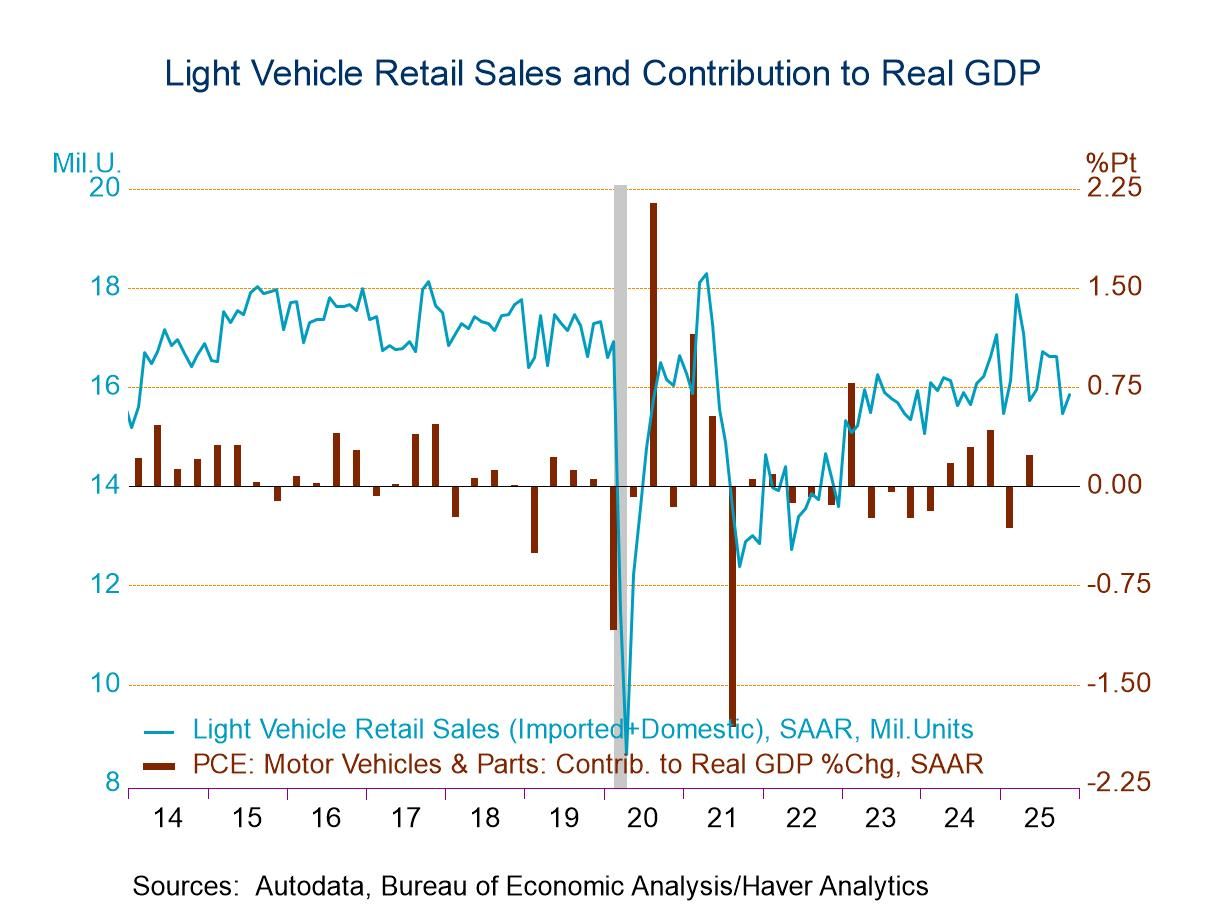
U.S. Light Vehicle Sales Edge Higher in November
- Light truck and auto purchases increase m/m.
- Passenger car sales continue to decline sharply y/y.
- Imports' market share increases.
by:Tom Moeller
|in:Economy in Brief
 USA| Dec 02 2025
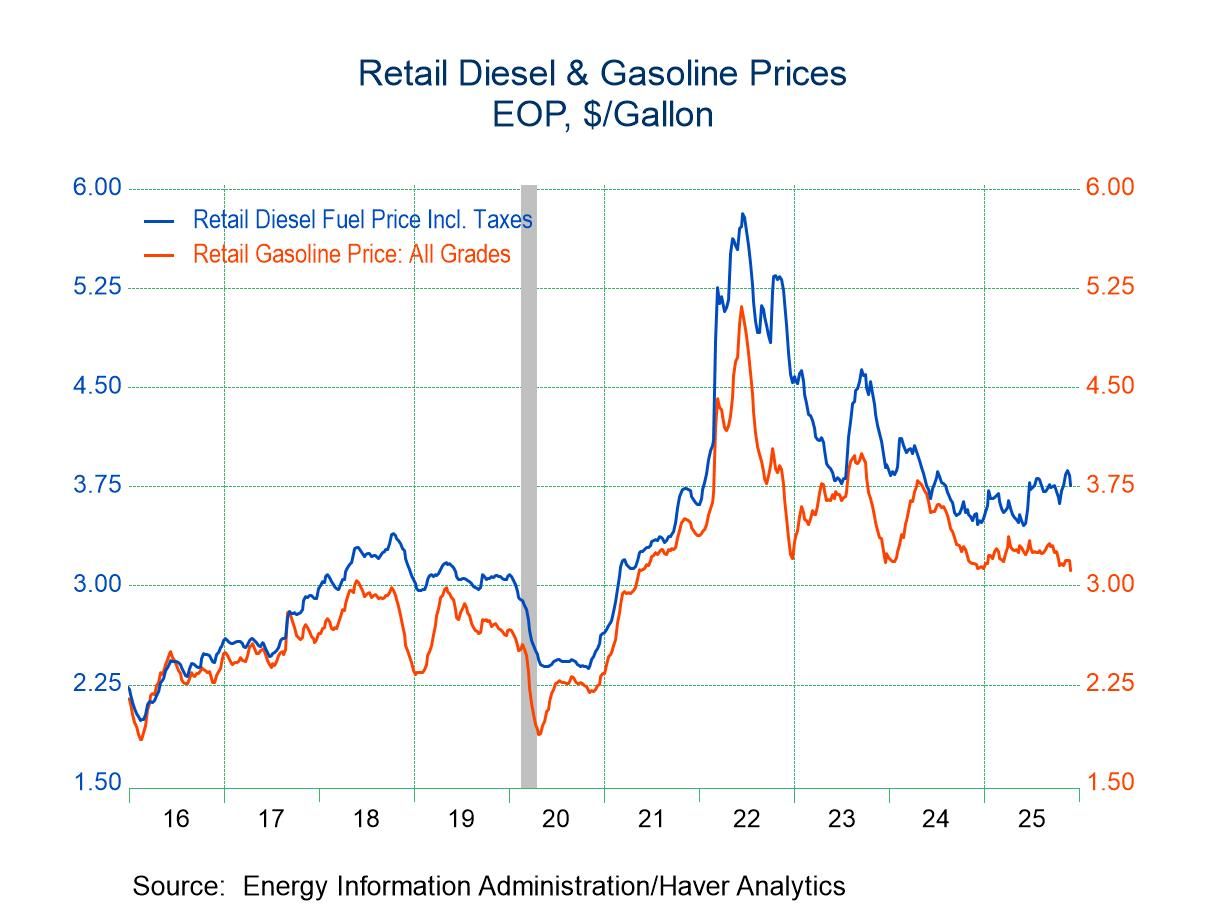
U.S. Energy Prices Are Mixed in Latest Week
- Gasoline prices fall week-to-week.
- Crude oil prices decline for fourth straight week.
- Natural gas prices move to highest level since February.
- Demand for gasoline & all petroleum products is little changed y/y.
by:Tom Moeller
|in:Economy in Brief
 Europe| Dec 02 2025
EMU Unemployment Holds Its Ground But There Is Erosion
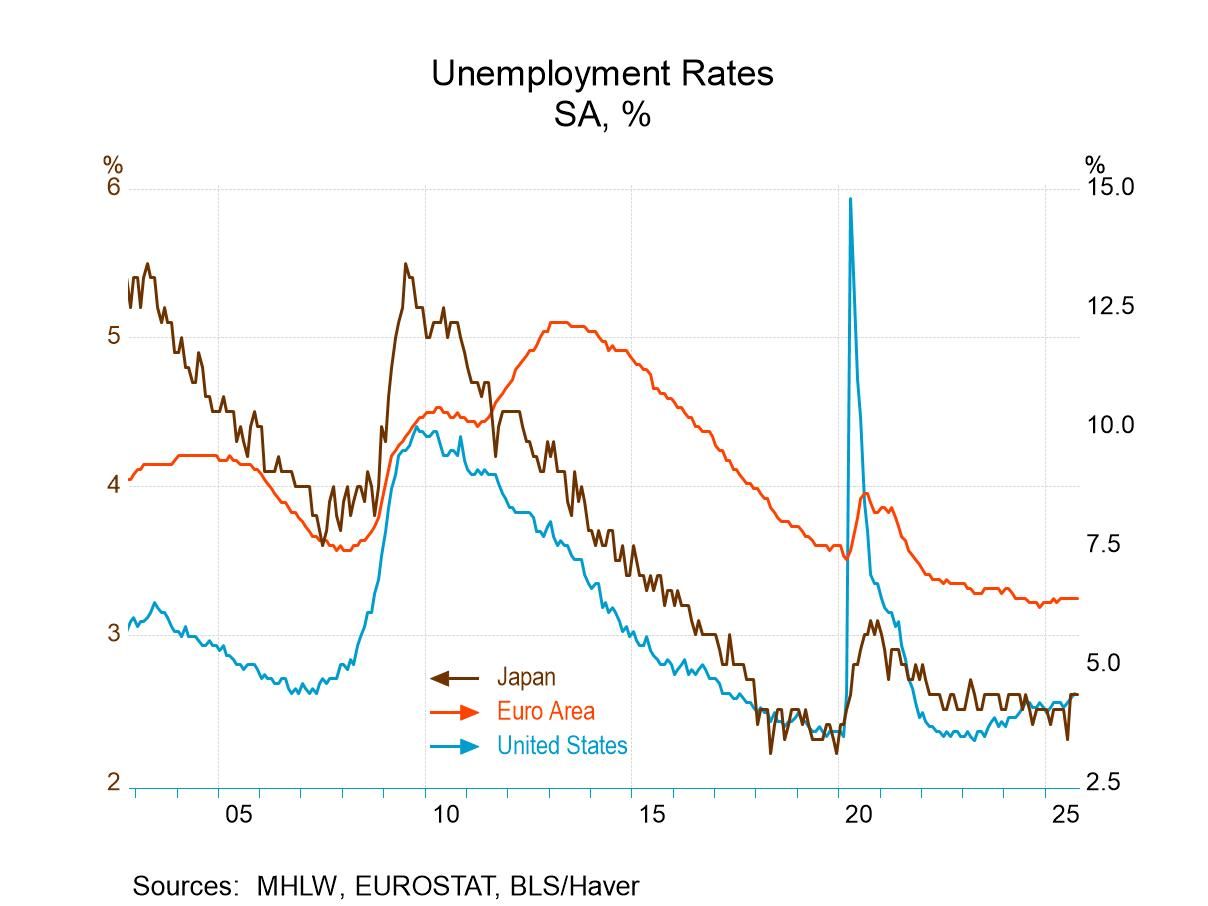
Unemployment rate holds in October Unemployment in the European Monetary Union held at 6.4% in October. That's just a couple of ticks off its all-time low. Unemployment at 6% is also just a couple of ticks off its all-time low in the European Union, and unemployment in the EU also was unchanged in October from September.
A good October Conditions in Europe for unemployment remain extremely favorable although there are signs of pressure and the rate itself is slightly off of its all-time low. October, however, was a pretty good month for unemployment as the table gives us unemployment statistics for 12 monetary union members. Among those 12, only three had unemployment rates rise: Finland (from 9.6% to 10.3%), Belgium (from 6.3% to 6.4%), and Austria (from 5.6% to 5.8%). Outmatching the rising unemployment rates, we're falling unemployment rates in Italy, Luxembourg, Ireland, Greece, and Portugal. The raw number of unemployed in October in the EMU fell (while the raw number of unemployed rose slightly in the EU).
Not such good September and August results In September, month-to-month unemployment rates rose more broadly in seven countries while falling and only two countries. In August, unemployment rates rose in five countries while falling in only two countries. October was an unusually good month for the unemployment rate that fell much more broadly than rose across these 12 monetary union members. Also in August and September, the raw number of unemployed rose month-to-month in each month in both the EU and the EMU.
A more tempered sequential look Sequential changes in unemployment rates over three months, six months and 12 months show some backtracking and potentially unemployment unrest. Over three months unemployment rates rose in six countries and fell in only two countries. Over six months, the unemployment rates rose in eight countries and fell in four countries. Over 12 months unemployment rates rose in seven countries while falling in four countries. The number of unemployed rose period-to-period in each of these time segments in both the EU and the EMU. Sequentially, there has been more backtracking than there has been progress. But the unemployment rates are so low even holding the line is an exceptionally good performance.
Ranking the unemployment rates The ranking of the unemployment rate for the European Monetary Union as a whole is in its 5.8 percentile; it has been lower 5.8% of the time. The unemployment rate in the European Union has been lower about 7.4% of the time. Unemployment rates are above their respective medians (which means above a ranking of 50%) only in Austria, Finland, and Luxembourg among EMU members.
Inflation: still stubborn Just released data show some inflation stubbornness in the monetary union. Core inflation (Country level) continues to be stubborn above ECB target of 2%. We have core inflation data for some selected countries in the union, and we do not yet have core inflation measures for the monetary union as a whole.
Baltic dry goods index is on a run higher Still, there some good news in the offing; oil prices continue to slip which is good for the longer term outlook for inflation and the Baltic dry goods index is making a significant ongoing push higher; it's currently sitting at high the highest point we've seen in over a year. That should be a good sign for the outlook for manufacturing and for the goods sectors of these economies. It’s also good news for the development of unemployment rates. The Baltic dry goods index is an index of global shipping volume; its revival is a welcome event in the wake of the Trump tariffs.
- of2693Go to 15 page