Financial markets have experienced renewed gyrations in recent weeks, as shifting geopolitical risks, questions around Federal Reserve independence, renewed talk of US dollar “debasement,” and ongoing enthusiasm surrounding artificial intelligence have combined to drive volatility across asset classes. These cross-currents have also contributed to a degree of rotation away from high-flying technology stocks, as investors reassess valuations and the timing of anticipated AI-driven gains. Against this backdrop, the charts in this week’s COTW highlight several important themes. Policy rate expectations now appear more balanced globally, marking a clear shift away from the one-sided easing bias of the past two years (chart 1), even as resilient US data—underscored by the unexpected jump in the January ISM index and a run of positive economic surprises—continues to complicate the outlook for monetary easing (chart 2). At the same time, US financial conditions remain relatively benign, with limited evidence of widespread credit stress or aggressive tightening in lending standards (chart 3). Meanwhile, the sharp rebound in semiconductor sales and the accelerating rollout of large-scale AI models underscore why investors remain so focused on the AI narrative, even as Europe lags behind due to weaker industrial momentum and a smaller footprint in advanced chip production (charts 4 and 5). Finally, while some scepticism about AI’s ultimate economic impact persists, the latest survey results suggest a moderation in concerns that markets are materially overestimating its gains (chart 6). Taken together, these developments paint a picture of a US economy that remains more resilient than many had anticipated, set against a financial landscape increasingly shaped by powerful—if sometimes competing—narratives around geopolitics, policy, and technological transformation.
 Global| Feb 05 2026
Charts of the Week: Balanced Policy, Resilient Data and AI Narratives

by:Andrew Cates
|in:Economy in Brief


More Commentaries
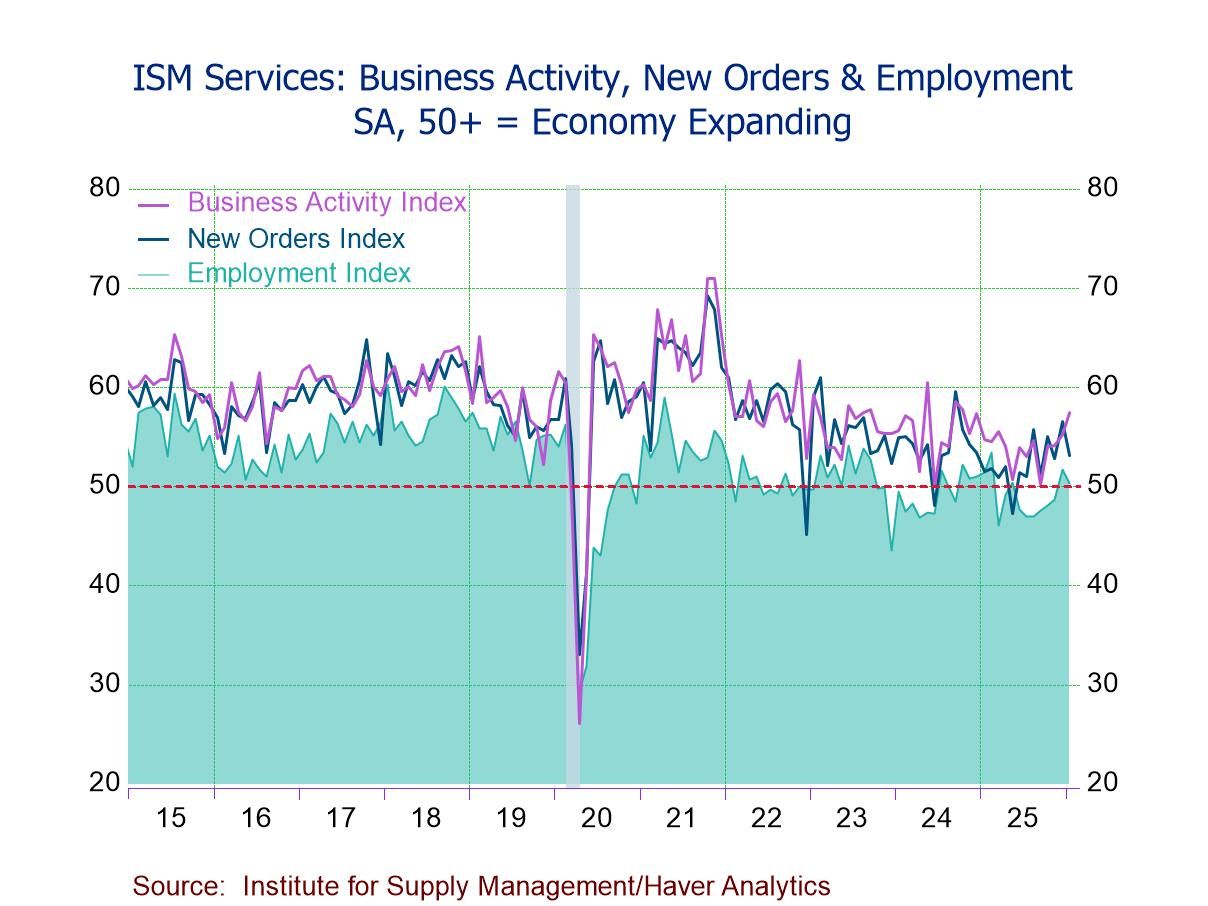
- ISM Services PMI 53.8 in Jan. & Dec., above expectations and the 12-month avg. of 51.8.
- Business Activity (57.4, 19th straight month of expansion), New Orders (53.1, eighth consecutive month of expansion), Employment (50.3, second successive month of expansion), and Supplier Deliveries (54.2 vs. 51.8).
- Prices Index (66.6) shows prices rising since June ’17, the fastest pace in three mths.
 USA| Feb 04 2026
U.S. ADP Private Employment Edged Up in January
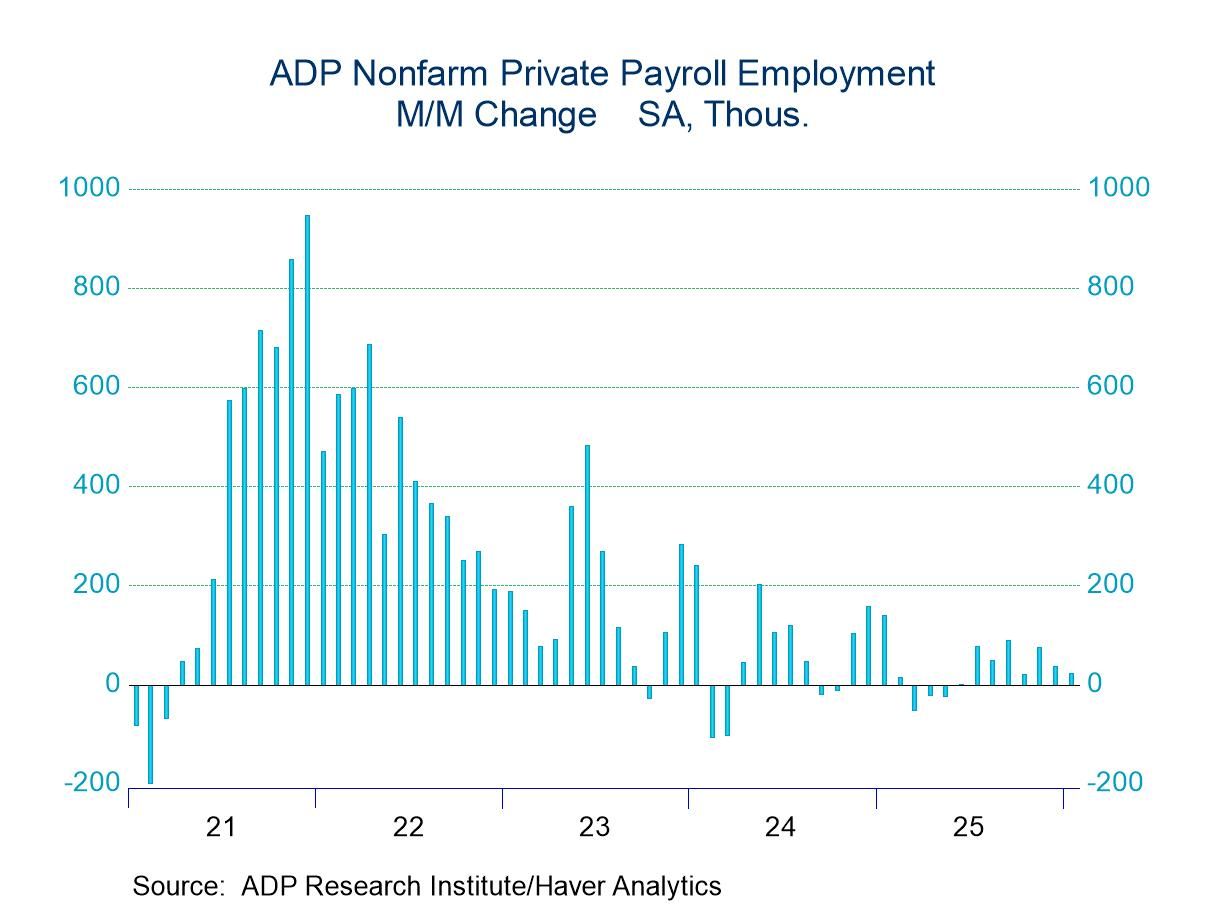
- Total private employment rose a less-than-expected 22,000 in January.
- Goods-producing industries added only 1,000 jobs while service-producing industries produced 21,000 jobs.
- A 74,000 surge in education and health services jobs more than accounted for the overall January gain.
- Manufacturing lost 8,000 jobs. Manufacturing has lost jobs in every month since March 2024.
by:Sandy Batten
|in:Economy in Brief
 Global| Feb 04 2026
S&P Composite PMIs Creep Higher
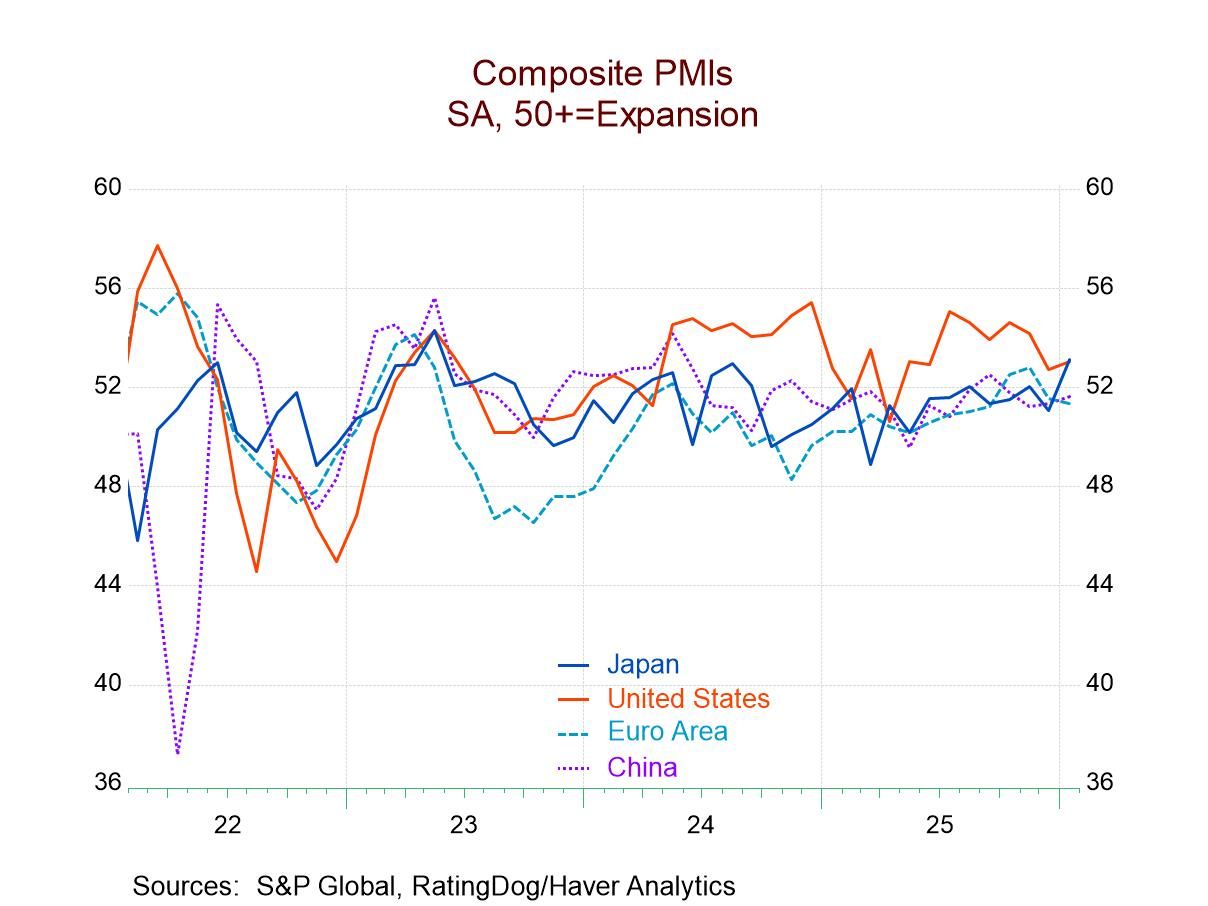
Composite PMIs for January show fewer reporters weakening in January compared to December with only about 40% of the reporters getting weaker month-to-month. The sequential data weakening versus strengthening shows that over 12 months 43.5% of reporters weakened, over six months 26.1% weakened, while over three months 43.5% weakened indicating that over this period, and - in recent months as well - the broad sequential periods are showing improvement as the underlying trend for global composite activity.
In January, 5 of 25 reporters had PMIs below a diffusion reading of 50, indicating contraction, compared to none in December and two in November. Over three, six and 12 months, the number of outright contractions varies between 2 and 4 based on average data. The percentile standing for ranked data over the period back to January 2022 shows a 61.7 percentile standing for the average of all of them, and a 61.9 percentile standing for the pooled data median. There is a stronger 85.7 percentile queue standing for an average of the United States, the United Kingdom, and the European Monetary Union where conditions have been firming although slowly..
The queue percentile standings across these 25 reporters’ composite indexes show that nine of them have rankings below their medians on data back to January 2022. Among all 25 reporters, only in France has 12-month, 6-month and 3-month average PMI readings below 50 in each of those time segments. France also has readings below 50 for its composite diffusion in two of the last three months.
When we look at rankings over a period, we also are interested in knowing what the performance has been over that span where we're creating these rankings. On these data back to 2022, only 6 reporters have average readings below 50, indicating persistent contraction. For the composite that's below 50, those reporters are Germany, France, Zambia, Ghana, Egypt, and Kenya. Only Egypt at 48.9 has an average reading below 49. Clearly the sense of contraction across this set of countries is small, moderate, and short-lived. At the other end of the spectrum, there are readings of 55 or greater for Sweden, India, Saudi Arabia, and the UAE; Singapore logs a reading at 54.4 for diffusion value.
The average and median data show that the readings have very gradually been drifting higher; however it's definitely a very gradual phenomenon. Looking at smoothed data, 12-month averages show 10 countries with readings below their respective 12-month averages of 12-months ago. However, only six of these show a reading that's one diffusion point or more weaker than it was one year ago. The biggest step back is from Brazil with a 4.5-point step back; the next biggest is Russia with a 2.1-point step back and Russian of course is engaged in war. There is a step back of about one point reported by Spain, the U.K., the UAE, Singapore, and Qatar. On the same metric, step ups of two points or more include Germany, Sweden, Zambia, and Nigeria with step ups of one point or more in Kenya, Australia, Ireland, and the U.S.
Over the whole 4-year period, the average country was in contraction for 14 months, a bit more than one year, accounting for 28.6% of the time. Over the last 2 years, the average country was in a state of contraction for 5.2 months or 21% of the time. Over the last year, the average country was in contraction 2.2 months or 18% of the time. The time spent under contraction has steadily fallen across the group. Over four years, three countries dominate the contraction with France, Egypt, and Kenya in contraction more than half the time (Egypt 89% of the time; France 71% of the time). Over 2 years, only Egypt and France were contracting more than half the time (Egypt 79% of the time; France 91% of the time). In the past one year, five countries are in a contractive state more that 50% of the time (France<91%>, Egypt<75%,> Brazil<75%>, Russia<50%> and Hong Kong<50%>). France and Egypt have serious structural issues. Only Saudi Arabia and the UAE have experienced no contractions over these periods (Ireland comes close, Singapore comes close, too). The top three countries dominate the contraction profile; that is France, Egypt, and a roving member, accounting for 29% of the contractions over four years, 40% over two years and 53% over the last year. These are countries with structural issues.
On balance, the composite PMI data are improving. On the chart the uptrend is visible, a definite tendency. These metrics are moving higher, but they are crawling at a very slow pace. It's encouraging that this improvement is also occurring in an environment in which inflation is improving or holding stable.
 Europe| Feb 03 2026
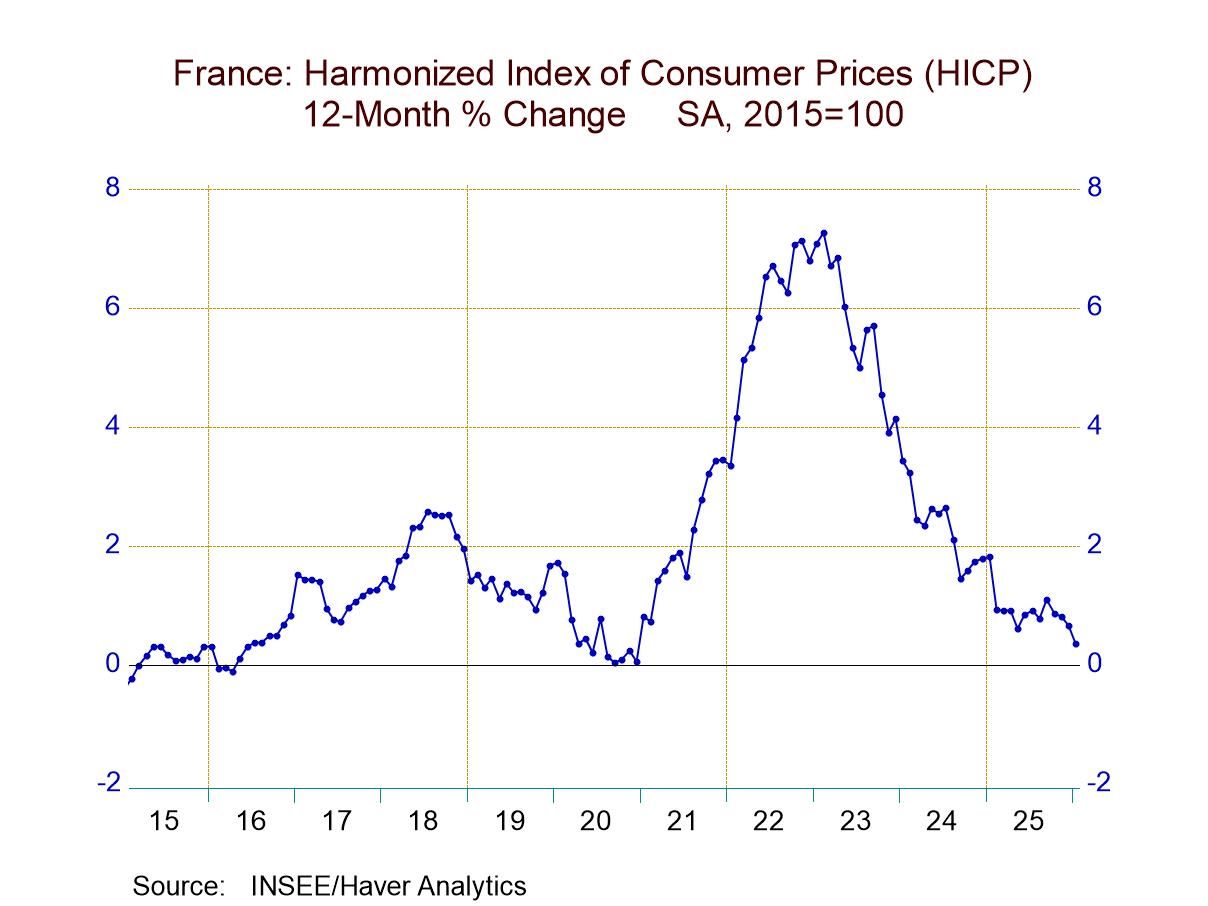
Inflation Tamed in France’s ‘Too-Early’ January Inflation Report
I have offered the table (below) as a presentation of French inflation statistics that is ‘too early’ largely because the report comes with a headline and without supporting detail. But the headline is too intriguing to wait for the details to emerge. To try to bridge that gap, I present the French detailed data for the CPI with the trends calculated based on a one-month lag. I also supplement that with the current report from Germany where the topical HICP reading for January is available, as it is for France. But Germany has also issued its domestic CPI data with detail. So, I present the domestic CPI trends without lag for Germany as a way to gain some better understanding about what's going on with inflation in the euro area and to gain perspective on France.
French-German comparisons; French results Of course, Germany is not France. We can't simply assume that the trends that we're seeing in Germany in January will translate through to France. But what we can do is notice what similarity/difference is there and point out that the sharp lowering of inflation in France is a French phenomenon and not a phenomenon that is shared by Germany. Therefore, the trend is not likely broadly applicable to the European Monetary Union. French inflation is running at only 0.4% over 12 months (!), annual rates of 0.2% over six months and three months; these are exceptionally low rates of inflation. In January, the French HICP index fell month-to-month by 0.1%.
German trends The German behavior is not really similar to this with the HICP at 2.1% over 12 months and then rising to annual rates of 2.8% over three months and six months, substantially similar to the sorts of numbers reported for headline inflation in the United States. The German domestic CPI reports slightly improving trends with annual inflation at 2.1%, six-month inflation at 2.1% at an annual rate, and at 1.6% over three months, inflation is tucked inside of the ECB 2% target over three months. The German CPI excluding energy - the early proxy that we have for the core rate - is at 2.4% over 12 months, 2.5% over six months and then drops to 2% annualized over three months. The month-to-month German data have been well behaved but not as weak as the monthly inflation numbers for the HICP headline monthly in France.
Different inflation in France and Germany; but a similar trend? So we have two bits of evidence here: one is that French inflation has really been behaving and it's quite weak. The other is that while German inflation is running at a higher pace and generally above the ECB target, there are also signs that German inflation is starting to come down over more recent periods.
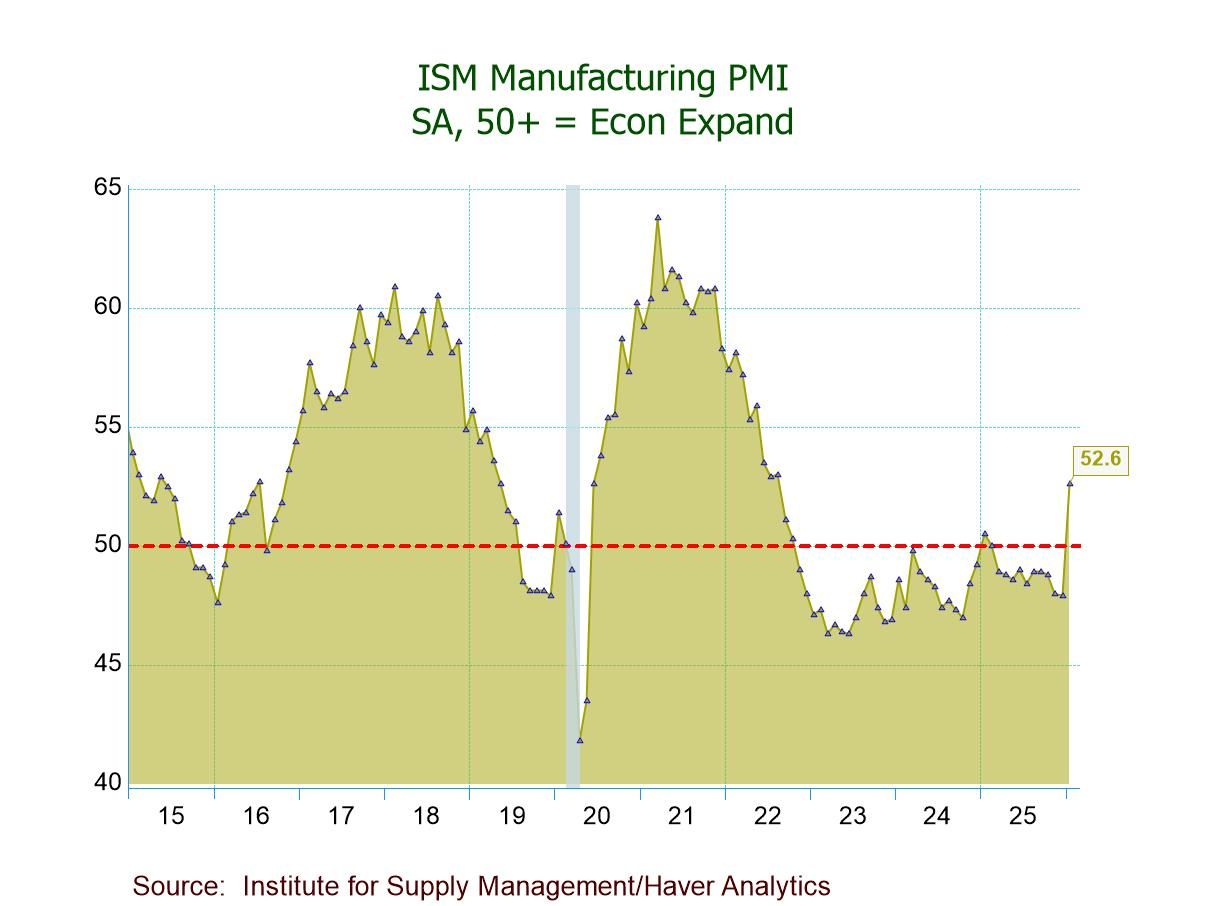
- ISM Mfg. PMI up to a higher-than-expected 52.6 in Jan.; first expansion since Jan. ’25.
- Production (55.9) expands for the fourth time in five mths.; new orders (57.1) expand for the first time since Aug.; both at their highest since Feb. ’22.
- Employment (48.1) contracts for the 28th straight mth. after expanding in Sept. ’23.
- Prices Index (59.0) shows prices rising for the 16th consecutive mth., the fastest increase in four mths.
- Exports (50.2) expand for the first time since Feb. ’25; imports (50.0) unchanged after nine mths. of contraction.
 Global| Feb 02 2026
S&P MFG PMIs Power Ahead; PMIs Improve; U.S. ISM blasts a hole through MFG Pessimism
An unexpectedly happy New Year in manufacturing land It's a new year - and a fine new year it is, baby! S&P manufacturing PMIs are showing consistent and broad improvement on a monthly and sequential basis. In January, of the 18 early reporting countries only 5 showed worsening conditions. The median reading for the month moved to 50.8 in January from 50.1 in December and 49.0 in November. It's a slow-motion slog, but on the other hand, it is a steady up creep from November. The PMI's median is up by 1.8 points since November, which may be small potatoes, but it's still significant progress.
Over three months the median reading rises to 50.0, compared to a reading of 49.5 on average over six months and a reading of 49.0 on average over 12 months. These sequential readings are also showing slow but clear stepwise improvement.
Breadth In terms of breadth, in January 72.2% of the reporters showed month-to-month improvement, compared to 44% showing month-to-month improvement in December and 50% showing improvement in November. Yes, the recent performance has shown improvement versus deterioration, and in the two prior months, diffusion has been pretty close to a 50-50 proposition. Then, in January, the upside exploded to a 72.2 percentile reading. Sequential data show that over 12 months 38.9% of the reporters showed improvement compared to a year earlier; over six months 50% of the reporters showed improvement compared to performance over 12 months. Over three months there was improvement of 61.1% of the reporters compared to their six-month metrics.
Unexpected strength These are steady and consistent improving readings, with some explosive improvement in the most recent three-month or one-month periods. This report is really something that was quite unexpected since the trend has been flat, sitting in this position of minor contractive lethargy for quite some time.
Most reporters log readings that imply growth The percentile ranking data show that only six of the 18 countries—one third of reporters—have percentile readings below the 50th percentile, based on data going back to January 2022. 12 of the 18 reporters have percentile standings in the 70th percentile or higher, and 4 of 18 are in the 80th percentile range.
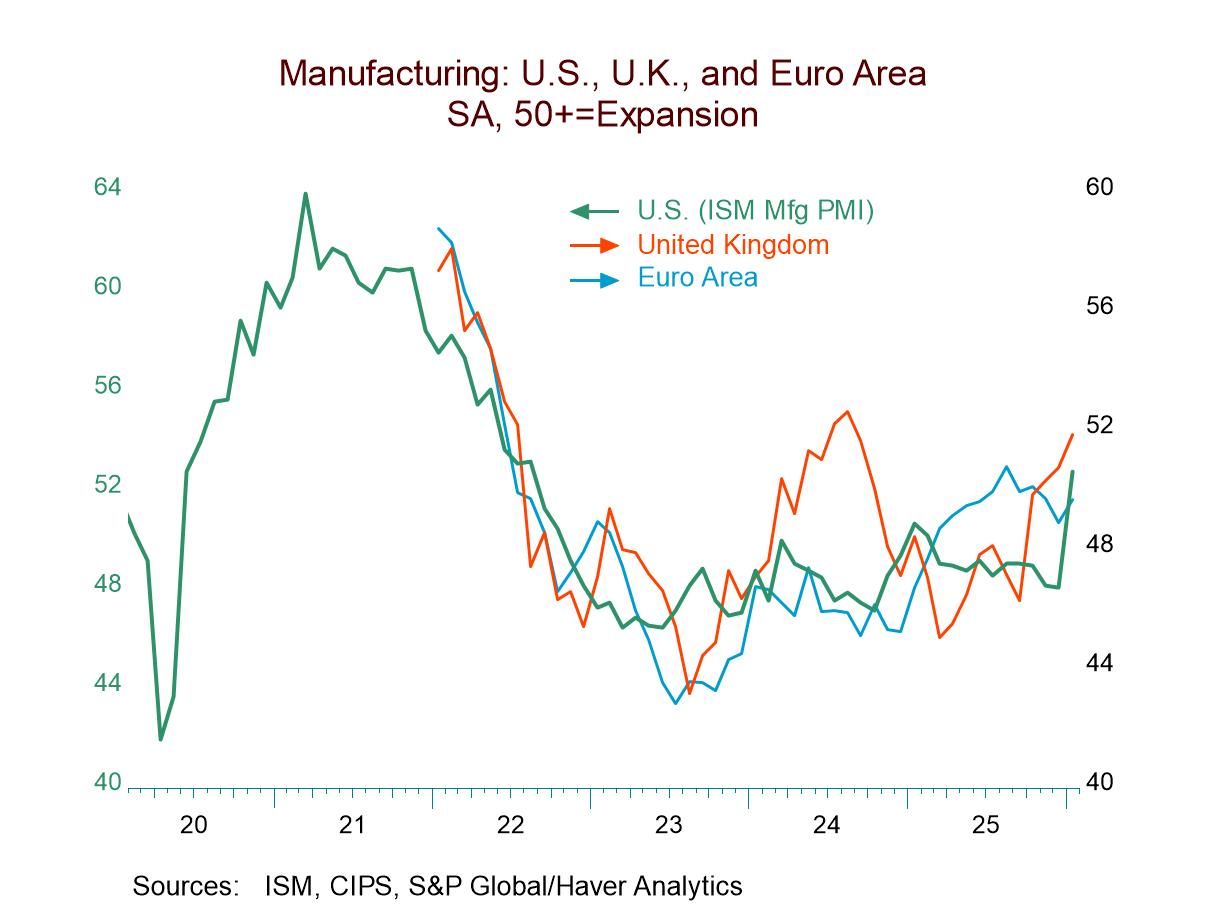
Strong showing in the U.S. a growth leader The breadth of this improvement is quite impressive. The table chronicles the S&P manufacturing PMIs. The chart plots these data for three regions but substitutes the U.S. ISM manufacturing reading freshly released today along-side the S&P readings. The U.S. ISM in January has simply exploded to the upside. That report’s headline snapped up to 52.6 in January from 47.9 in December; it was the strongest reading since the middle of 2022. The order diffusion reading jumped to 57.1, a month-to-month jump of nearly 10 points; the production diffusion rating rose by 5 points monthly; the prices-paid reading continued to snake higher; export and import ratings both rose relatively sharply. If the U.S. is a bellwether for how the rest of the world is going to perform, that bell is ringing loudly in January. The U.S. ISM standing evaluated on data back to 1996 gives an ISM queue standing at its 48.9 percentile – closing in on absolute normal.
Some U.S. detail… The U.S. weakness in imports would probably have something to do with tariffs. There also may be some negative spillovers that would affect exports, but exports would also depend more directly on activity overseas, which the PMI data from S&P suggests has begun to pick up. Employment, which showed an improvement on the month, is still lagging with a 31-percentile standing. However, the rest of the manufacturing readings are really quite solid, quite strong. And in terms of levels instead of rankings, all of the U.S. PMI readings are above their 50% mark in the ISM survey except for inventories and employment. Employment has a 48.1 percentile standing - not a terrible result, especially for a sector whose employment share has been dropping chronically for decades.
 Asia| Feb 02 2026
Economic Letter from Asia: The AI Resource Race
This week, we examine Artificial Intelligence through an Asian lens, focusing on how the region fits into the broader AI value chain. While the US clearly dominates at the frontier—spanning cutting-edge AI model capabilities, chip design, and data centres—it remains heavily reliant on more foundational segments of the value chain.
We begin with first principles, looking at the raw material inputs required to produce AI chips, where China continues to hold a dominant position (chart 1). We then turn to the chips themselves, highlighting Taiwan’s well-known leadership in advanced semiconductor manufacturing and its critical role for both the US and China (chart 2). That said, recent efforts by both the US and China to reduce external dependence are beginning to show up in the data (chart 3), and could reshape this landscape in the years ahead. Next, while the US still leads in data centre capacity—the infrastructure essential for training and deploying AI models—several Asian economies, notably Malaysia, are seeking to capture a larger share of this rapidly expanding segment. These efforts have been met with strong interest from global technology firms, translating into sizable foreign direct investment inflows (chart 4).
Underpinning the entire AI ecosystem, however, are rapidly rising electricity requirements. China is now the world’s largest consumer of electricity, while other aspiring AI players, including India, will also need to confront the growing energy demands that come with deeper participation in the AI space (chart 5). At the same time, economies that have made significant shifts toward certain renewable energy sources must contend with higher electricity prices. This may create pressure to slow—or in some cases reconsider—the pace of the green transition in order to remain competitive in the intensifying race for AI-related resources (chart 6).
AI chip material production We begin with the most critical raw inputs required to produce AI chips. Beyond silicon—the foundational material on which chips are built—China commands substantial market share and dominance in the production of other key chipmaking materials, notably gallium and germanium. China accounts for a near-total share of global gallium production and roughly 68% of germanium output (chart 1), levels that effectively give it the ability to steer these markets. China has demonstrated this leverage before, most recently through temporary export restrictions on critical minerals enacted last year amid tit-for-tat measures between the US and China. Those controls were eventually paused following a subsequent US–China trade agreement. Even so, the episode served as a stark reminder of China’s strong negotiating position in the semiconductor supply chain—despite the US retaining leadership in the sophistication and advancement of AI models.
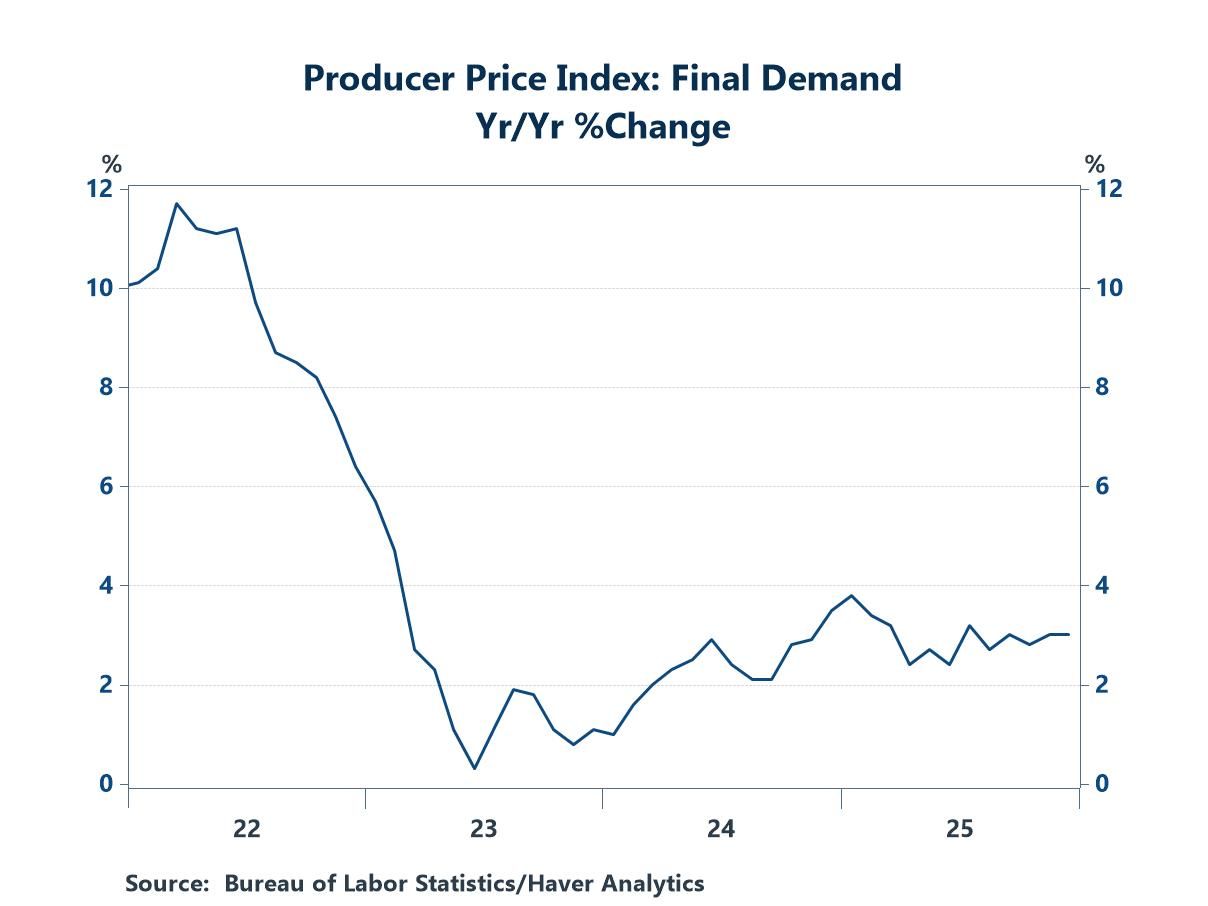
- Prices of food and energy declined in December, but service prices surged.
- Prices of goods excluding food and energy rose more than the recent average, but the change did little damage to the underlying trend.
- of2693Go to 1 page