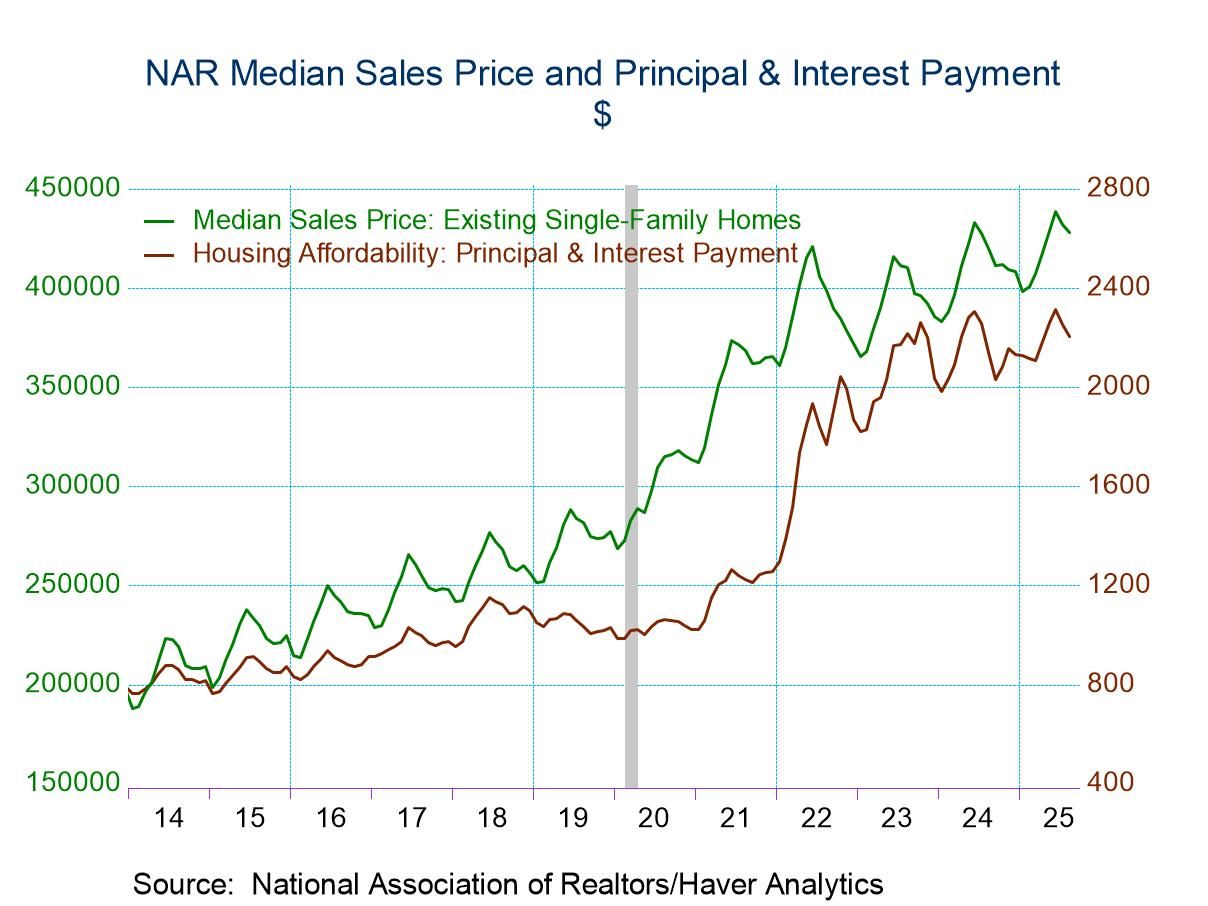
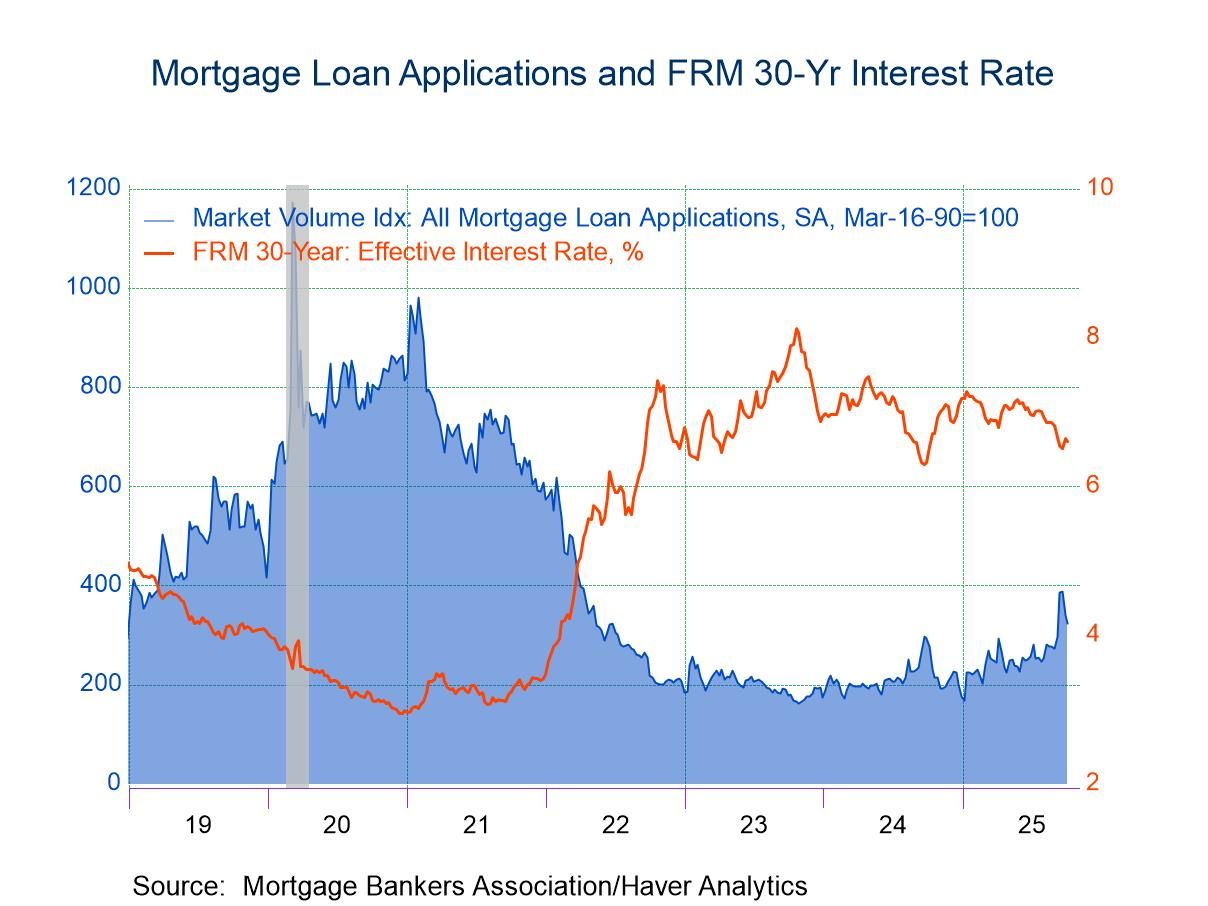
- Home prices & mortgage rates decline for second straight month.
- Median income continues to edge higher.
- Affordability increases across country.
- USA| Oct 10 2025
U.S. Housing Affordability Increases in August
by:Tom Moeller
|in:Economy in Brief
- Europe| Oct 10 2025
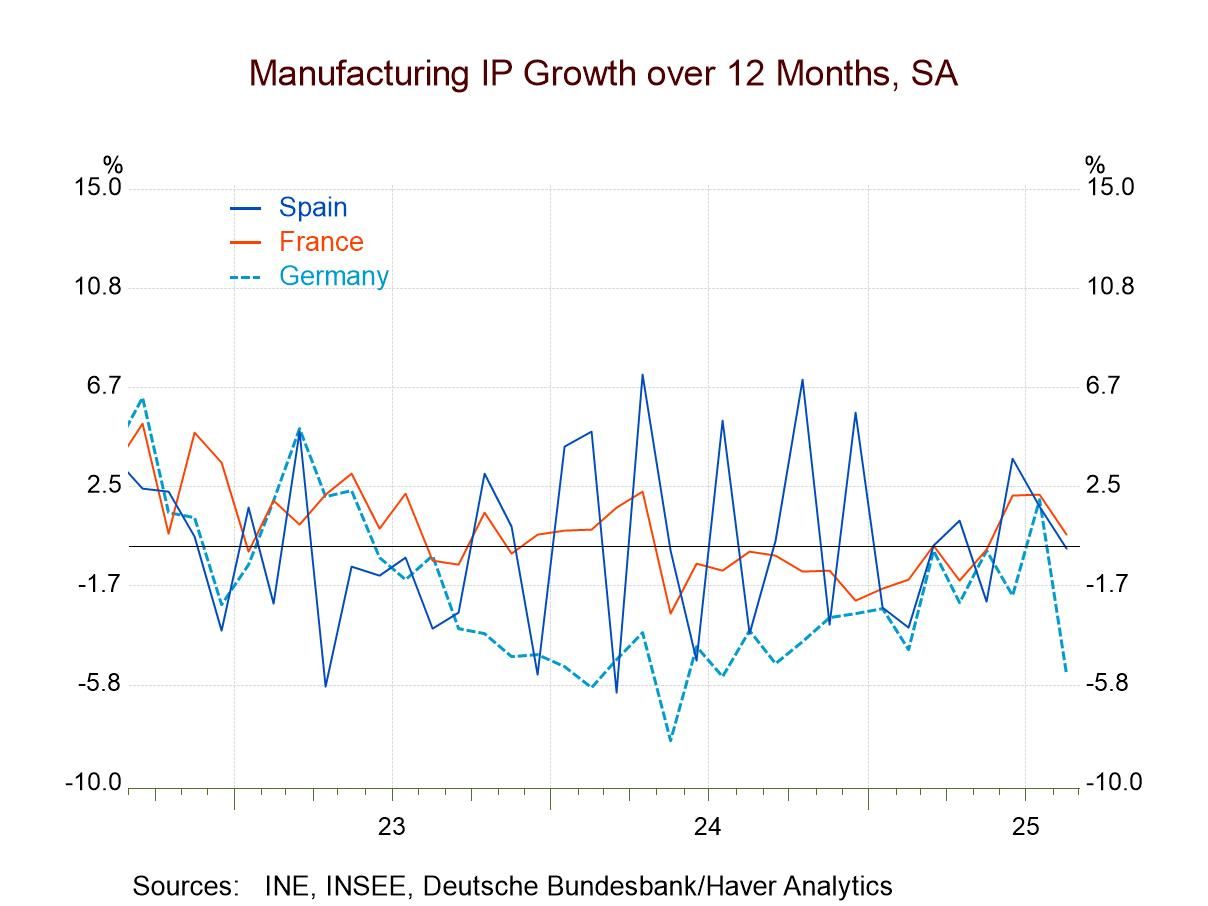
Another Mixed Month for EMU IP Trends
Manufacturing trends in the European Monetary System in August were mixed. Among the 13 countries reporting early industrial production data, six reported output declines.
Looking at the three most recent months of data, June, July, and August, there are four countries that are showing growing weakness month-to-month for each of those three months. Those are Austria, Belgium, France, and Greece. Only two countries are showing steady acceleration over the span; those are Ireland and Portugal.
Looking at sequential data, growth over 12 months, six months and three months, progressive weakening is seen in four countries Germany, Spain, Ireland, and Portugal that compares to acceleration in Belgium, France, and the Netherlands. In terms of Monetary Union nonmember countries, Sweden is showing persistent acceleration while Norway is showing persistent but very moderate deceleration.
These data are rife with contradictions as no accelerating/decelerating trend sequentially persists over the next three months in the same direction. The European Monetary Union is clearly in a period of transition in terms of growth and conditions have been weak and are not yet breaking out to the upside. What this tells us is that a period of acceleration has not yet stepped up and weakness, even deceleration has lingered. Quarter-to-date data show us that there are output declines in most of these economies with only five EMU Members showing output growing in the quarter-to-date period.
This continues to be part of an extended period in which industrial output has been extremely weak: we can support that with the numbers. Looking at these 13 members, we assess the ratio of industrial production today compared to where it was in January of 2020 before COVID struck and before the Russian invasion of Ukraine. This comparison goes back 5 1/2 years; Germany, France, Italy, Spain, Luxembourg, and Portugal all have levels of output today in terms of manufacturing output that are lower than they were in January 2020. This is a very long period to go without having output recover to its level in January 2020.
Separately the table ranks countries on growth rates, This ranking is a ranking of output growth on 12-months rates over data since 2007. On that basis, seven of the countries in the table have year-over-year growth rates below the median growth that they had during this period back to 2007. That's slightly over half of the monetary union countries in the table that are reporting growth rates below their median for this extended period of 20 years, much of it delivering very weak growth.
Hope springs eternal, for a manufacturing rebound. Central banks right now are trying to run relatively accommodative policies and are tolerating some inflation overshooting to do that; however, it doesn't appear to have been enough to excite any acceleration in manufacturing output. Europe continues to be challenged in terms of manufacturing growth. There is really nothing in these data that make us optimistic that conditions are getting better.
 Global| Oct 09 2025
Charts of the Week: Shutdowns and Shake-Ups
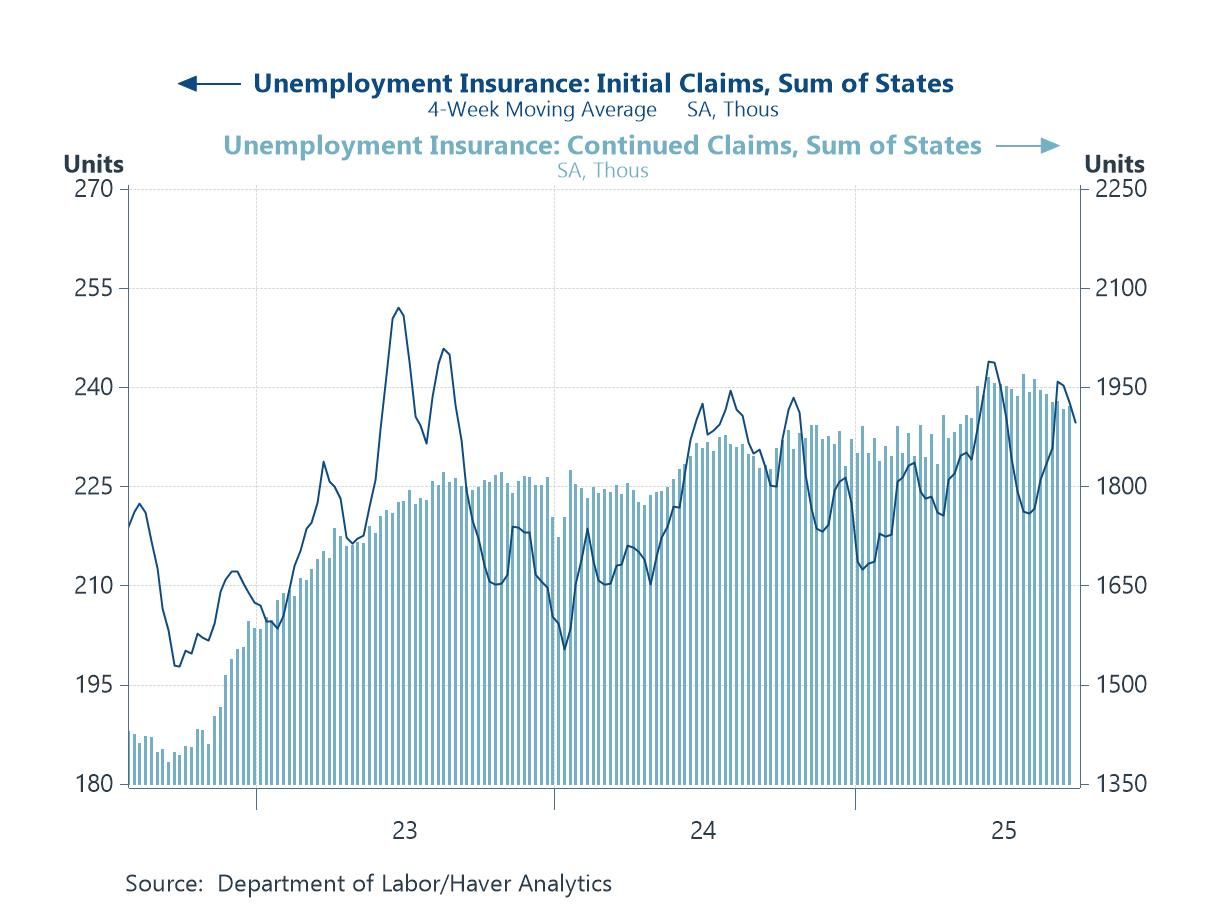
Financial markets have been navigating a US government shutdown that has frozen key data releases and muddied the macro picture, while political cross-currents in Europe and Asia have added to the noise—France has seen yet another prime minister resign, while Japan’s leadership change is being read as a tilt toward easier fiscal policy. With official US data dark, investors are leaning on proxies—such as Haver’s state-sum jobless-claims series—to keep tabs on labour market momentum (chart 1). From there, our remaining charts this week point to an uneven global macroeconomic story: US labour productivity has remained well ahead of peers, a lead that maps closely to cheaper electricity—where power costs are low, capex and margins hold up; where they’re high, manufacturing strains and measured productivity sag (charts 2 and 3). Yet produced capital continues to climb even as natural capital per capita erodes, helping to keep real energy costs sticky and weighing on the world’s productivity fabric (chart 4). In markets, Japanese equities have surged on policy-support hopes even as yen softness lingers (chart 5), and in emerging Asia, Vietnam’s Q3 GDP shows re-acceleration and firming domestic demand, though exposure to evolving US tariff policies is keeping the export outlook uncertain (chart 6). Net-net: growth pockets persist, but high real energy costs, policy shifts, and patchy visibility argue for a choppy, bifurcated path ahead.
by:Andrew Cates
|in:Economy in Brief
- Germany| Oct 09 2025
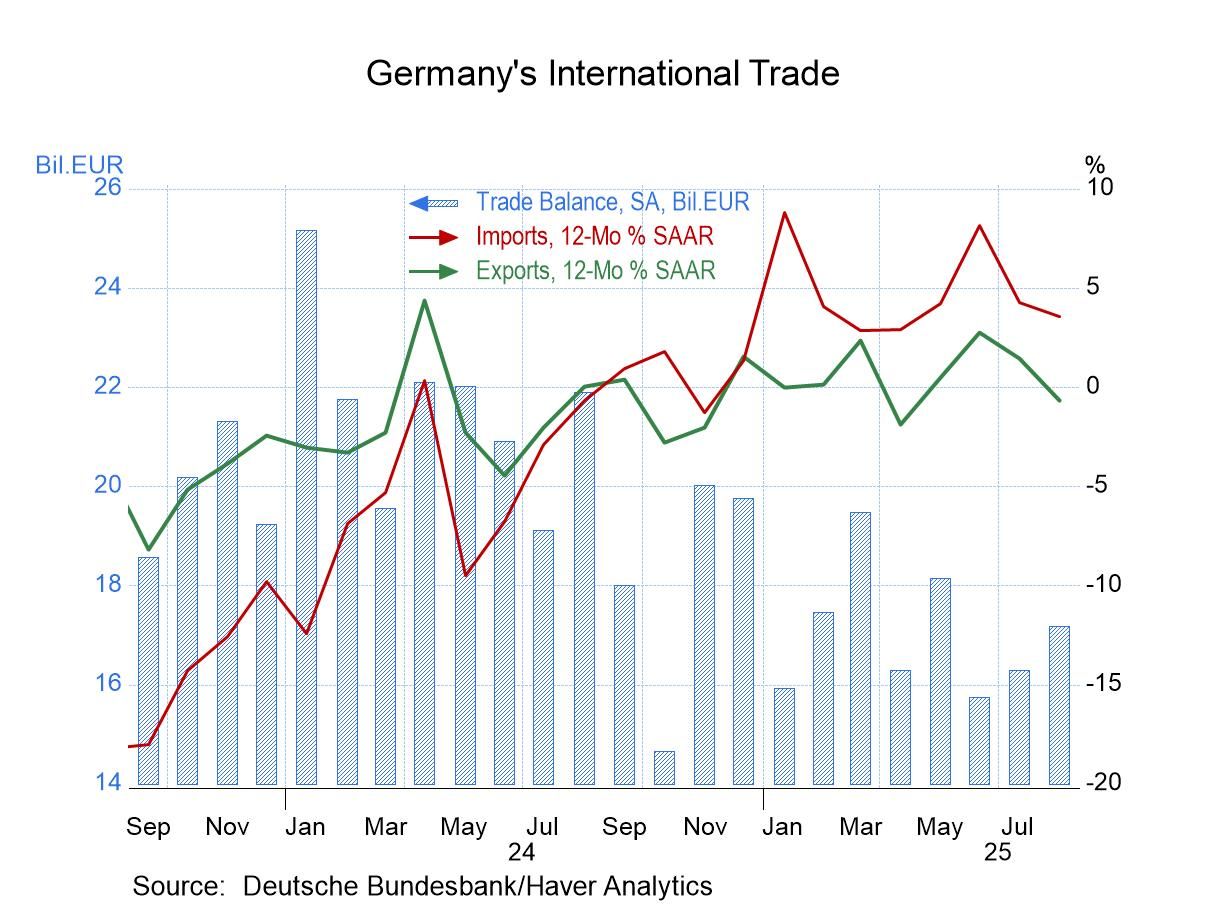
German Exports Wither and Imports Drop
Germany shows signs of withering domestic demand in the face of weaker foreign demand. German exports weakened in August, falling by 0.5% month-to-month. The drop in German exports to the U.S. was being highlighted at a 2.5% month-to-month decline, but its exports to EMU members were down by 2.2% as well and exports to non-EMU members of the EU were lower by 3.1%. In fact, German exports outside the EU area rose by 2.2% largely on exports to China.
Exports to the U.S. vs. European trends The German website highlights a large drop in German exports to the U.S. from August 2024, a period over which German exports to the U.S. are off by some 20%. This is a much sharper drop than the German overall result that shows a decline of less than 1% over the past year for total exports. However, on the near-term comparison, German exports to the U.S. seem to be behaving a lot like German exports to its closer European neighbors.
World trade The Baltic dry goods index shows a sharp recovery in world trade volume (in dry goods; excluding tanker volumes) from a dip in early-2025. From early 2025 to date, trade volume readings on the Baltic index are among some of the stronger readings since 2022.
German orders imports, demand German orders data had also flagged weakness in external orders. Overall orders show weakness, but domestic orders remain strong and are accelerating. Still, the recent (August) IP report showed declines on the month and growing output weakness - despite strong domestic real orders. In today’s trade report, we are seeing some weakness in Europe and among the EU’s non-EMU members plus trade weakness with the United States. This is partly compensated for by strength elsewhere and a part of that is German exports finding some demand in China. All the geographical references are up to date through August.
Overall German trade patterns However, German overall trade showing German domestic import strength with real and nominal imports rising solidly and even strongly over 12 months and six months but giving some ground over three months. German nominal and real export trends are showing some growth except over three months but at that, the pace generally is weaker than the pace for imports.
- USA| Oct 08 2025
U.S. Mortgage Applications Fell in Latest Week
- Mortgage applications fell 4.7% w/w in the week ended October 3.
- Applications are on a modest uptrend but are still correcting from the outsize jump in mid-September.
- Fixed mortgage rates were mixed with the 15-year rate up a bit and the 30-year rate down slightly.
by:Sandy Batten
|in:Economy in Brief
- Japan| Oct 08 2025
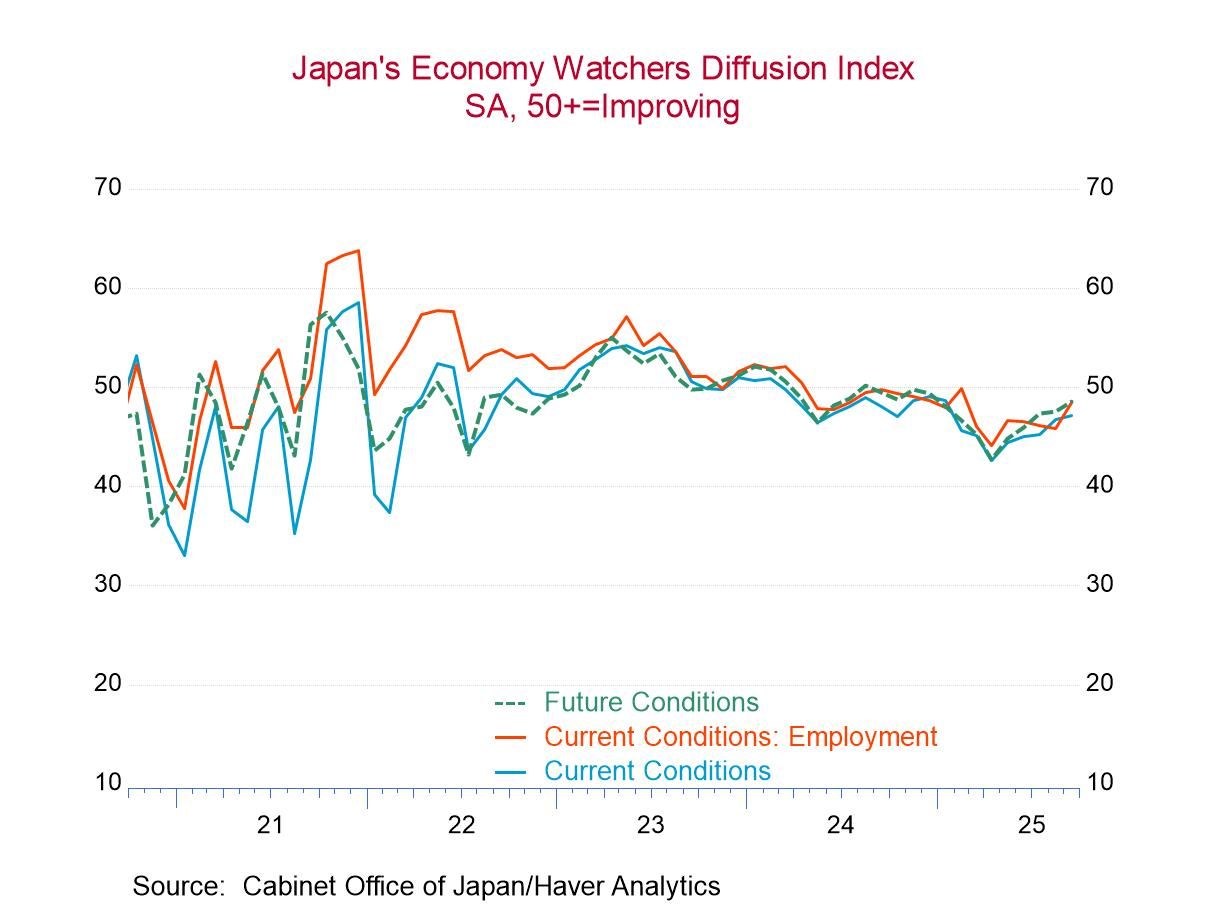
Japan’s Economy Watchers Index Advances
Japan's economy watchers index in September advanced to 47.1 with the future index rising to 48.5. The current index rose month-to-month by four-tenths of a percentage point while the future index rose by a full diffusion point.
The Current Index In September, among the 9 detailed categories, all but three of them improved in the current index, in August all but two had improved, and in July all but four had improved.
Sequential changes- The sequential changes on the current index shows that over three months the headline and all components improved, over six months the headline and all components also improved, but over 12 months only two components improved and the headline falls back by about nine-tenths of one-point. Improving over 12 months are only the assessments for services and for housing
Rankings- The ranking statistics for the current index show only two components below a rank-value of 50%, which means only two components are below their respective medians on data back to 2004. However, the current readings show the headline and all components below diffusion values of 50 in September, indicating contraction both overall as well as in each category. This combination of observations is a stark reminder of how weak Japan’s economy has been, that contracting diffusion values are above their medians. In the case of housing with a 73.5 percentile standing – a standing that, on its own seems quite solid, corresponds to a monthly diffusion value at 49. Housing diffusion has been stronger than a diffusion value of 49 only about 27% of the time (over the past 21-years).
The Future Index The future responses are similar in nature to the current responses. Recent diffusion values have mostly been improving monthly. Only two were weaker in September, compared to four in August and none in July. The future index, however, has two September readings above diffusion values of 50: for eating & drinking places and for nonmanufacturers. In August services read above a 50 diffusion value (even as the weaken month-to-month) and in July three component responses are above 50.
Sequential changes- Over three months all components improve except employment; that result is replicated over six months. Over 12 months only three categories are improving: eating & drinking, housing, and nonmanufacturing.
Rankings- Only two sectors rank below 50% (below their respective medians) in September; those two are services and employment expectations). The headline standing is above 50% at 50.2%, unlike for the current reading where the headline standing is at 48.2%. However, we once again see that 5 sector readings in the future survey have diffusion values in September below 50 but are above their respective medians. The same is true of the headline for the future index. The median phenomenon has been a moderate contraction over the last 21 years.
- USA| Oct 07 2025
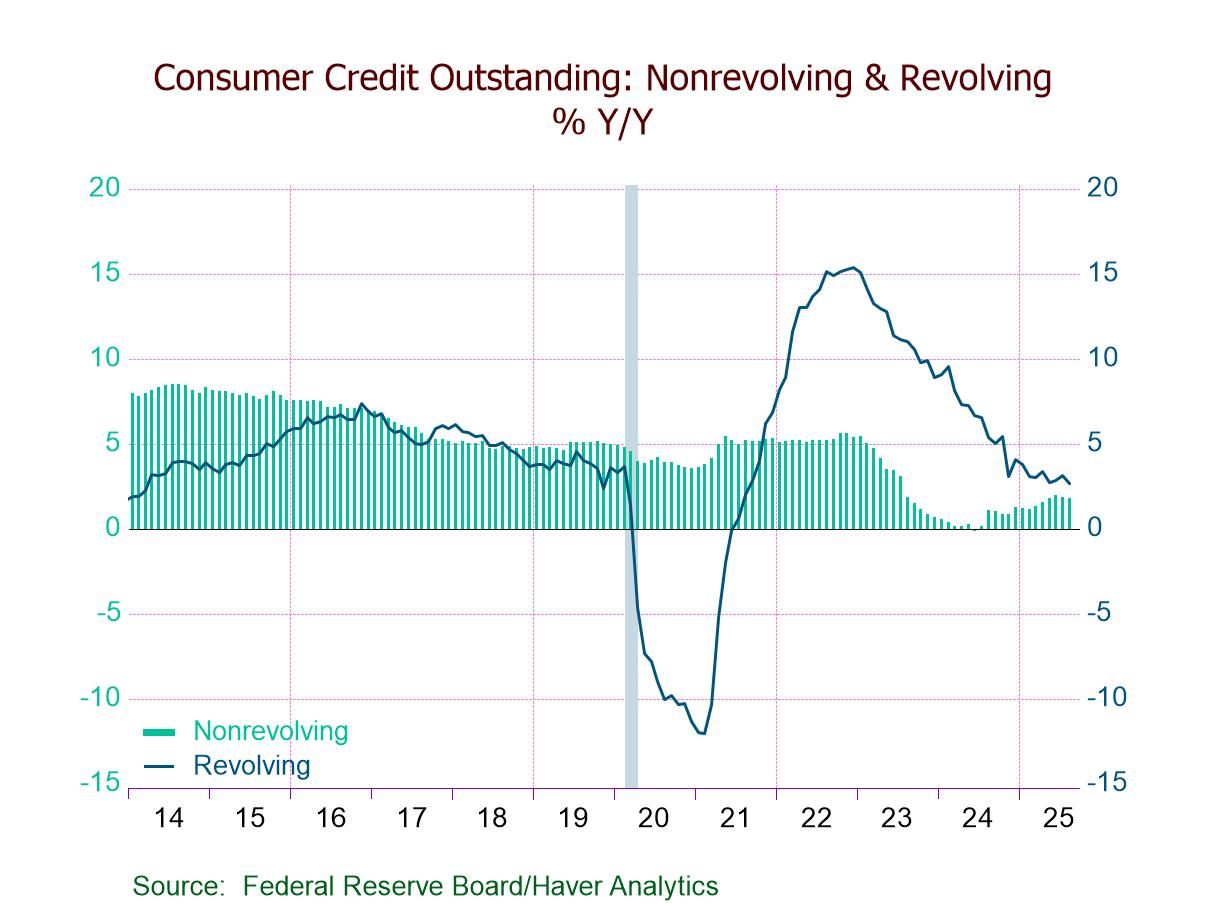
U.S. Consumer Credit Growth Slows in August After July’s Surge
- Consumer credit growth hits a six-month low.
- Revolving credit sees the first m/m decline since May.
- Nonrevolving credit posts the smallest m/m increase since March.
- USA| Oct 07 2025
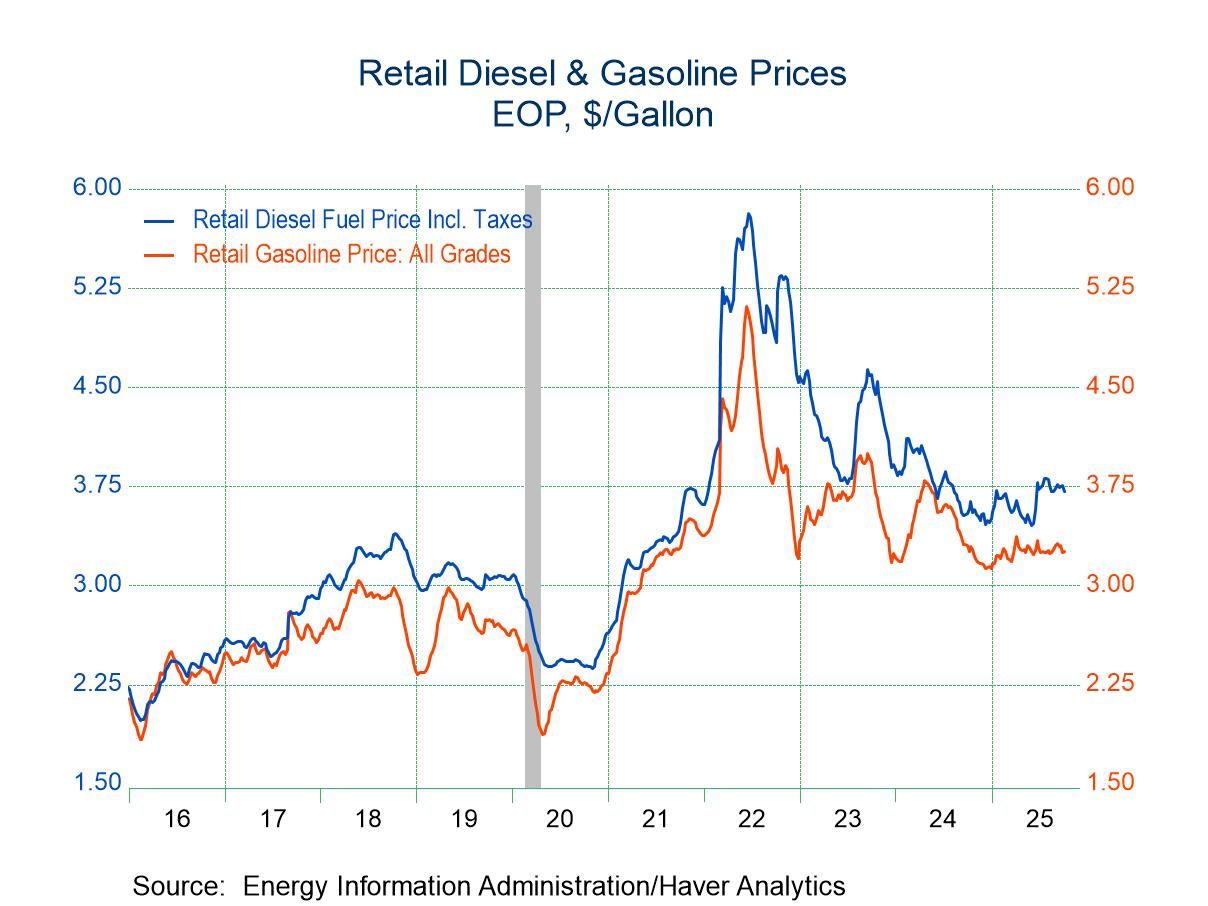
U.S. Retail Gasoline Prices Unchanged as WTI Price Falls
- Retail gasoline prices unchanged in latest week.
- The price of WTI fell to $61.79, its lowest since the week of May 30.
- The price of natural gas rose 26 cents to $3.16, the highest since July 25.
by:Sandy Batten
|in:Economy in Brief
- of2693Go to 27 page


