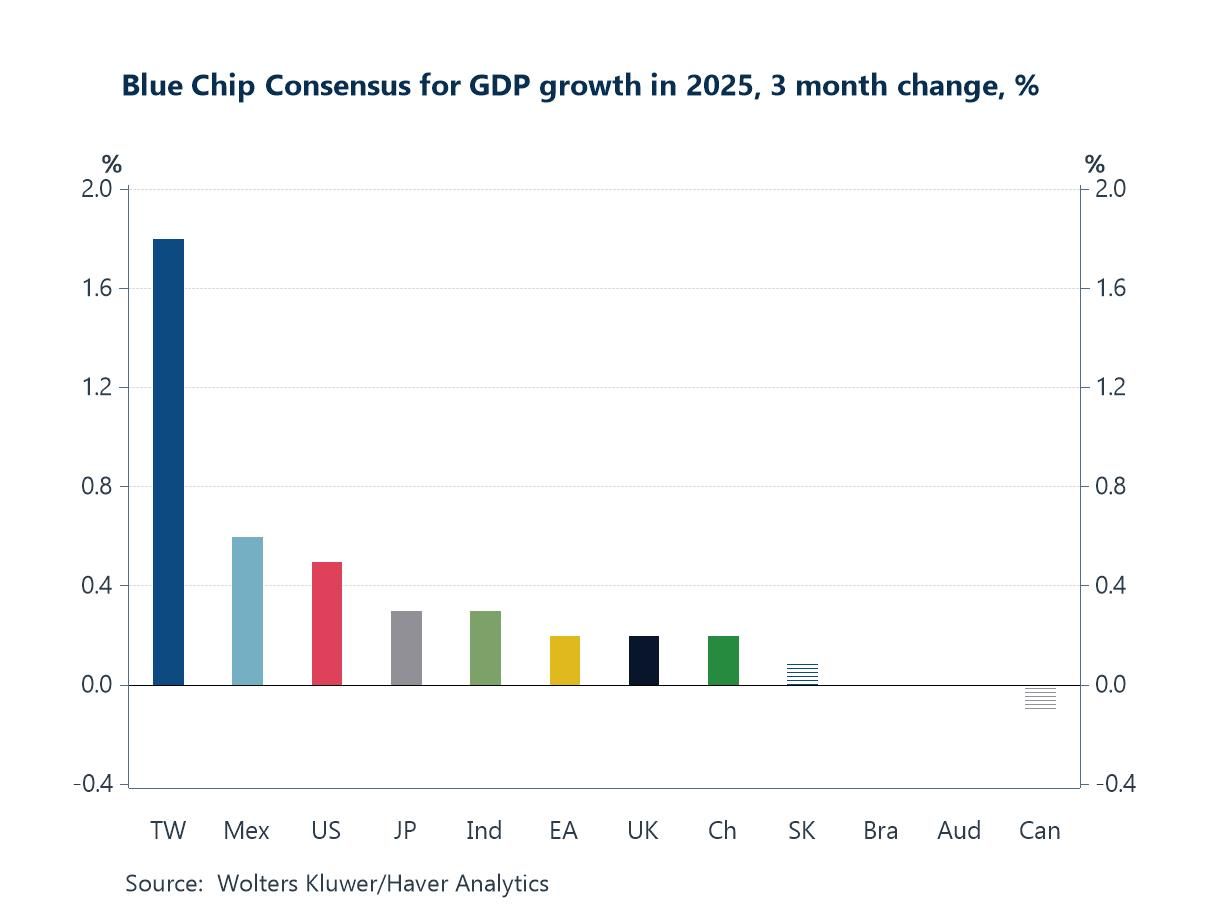
Global financial markets are entering mid-October with a cautiously optimistic tone, supported by a mix of better macro data and easing geopolitical risk. This week’s latest IMF forecasts nudged global growth expectations higher for 2025, broadly in line with indication from the latest Blue Chip consensus, where revisions have been led by economies tied to the tech and semiconductor cycle (chart 1). That same dynamic is evident in the US, where surging AI-driven data-center investment has emerged as an unexpectedly powerful growth driver (chart 2). Still, the timing of AI’s broader payoff remains uncertain—forecasters see labor-market disruption coming before a measurable productivity boost, underscoring an important macro risk if investment runs ahead of realized gains (chart 3). On the geopolitical front, the announcement of peace in Gaza this week has also pushed global oil prices down, providing a welcome disinflationary impulse (chart 4). At the same time, US–China trade tensions remain troubling. China’s export growth in September was stronger than expected but with gains concentrated in ASEAN and the EU, while shipments to the US continue to contract (chart 5). Meanwhile, in the UK, signs of a loosening labor market have added to expectations that the Bank of England could deliver further rate cuts in the months ahead (chart 6). Against this backdrop—buoyed by AI optimism but clouded by policy uncertainty around the US government shutdown, US–China frictions, and execution risks on technology—the global outlook has brightened modestly, but remains finely balanced.
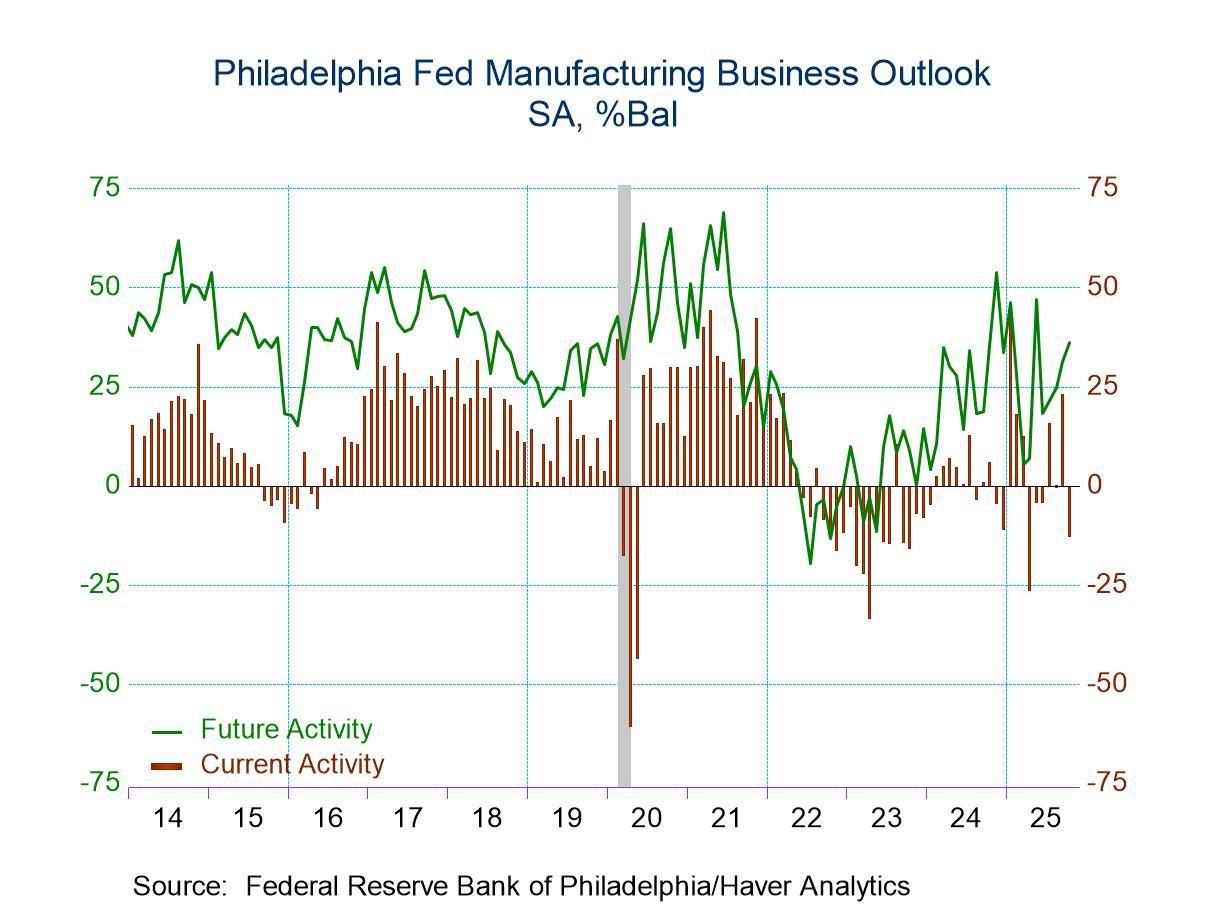
- Current General Activity Index reverses earlier improvement.
- Inflation reading increases.
- Future General Activity Index rebounds to five-month high.
by:Tom Moeller
|in:Economy in Brief
 USA| Oct 15 2025
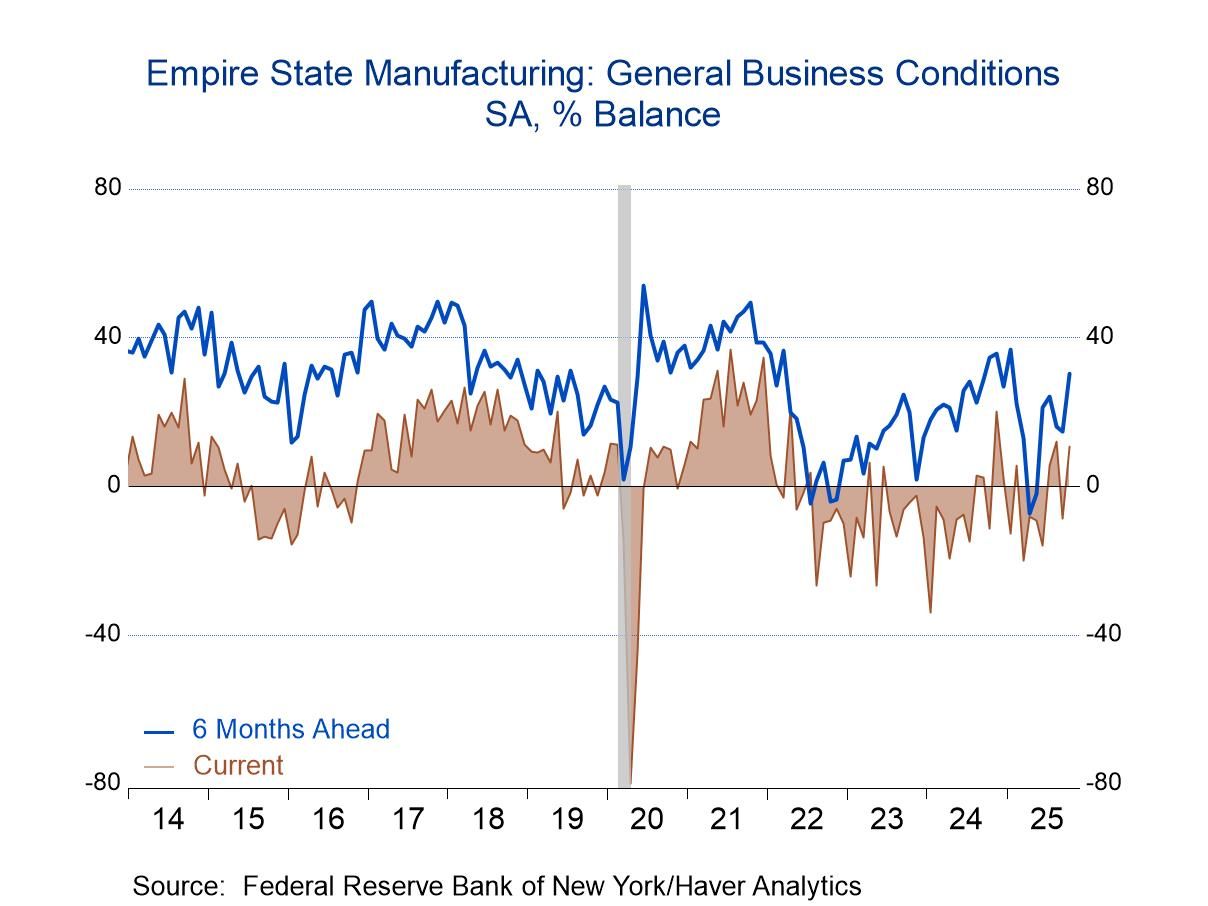
Empire State Manufacturing Index Strengthens in October
- New orders, shipments & employment rebound.
- Prices paid & received improve.
- Six-month outlook strengthens.
by:Tom Moeller
|in:Economy in Brief
 USA| Oct 15 2025
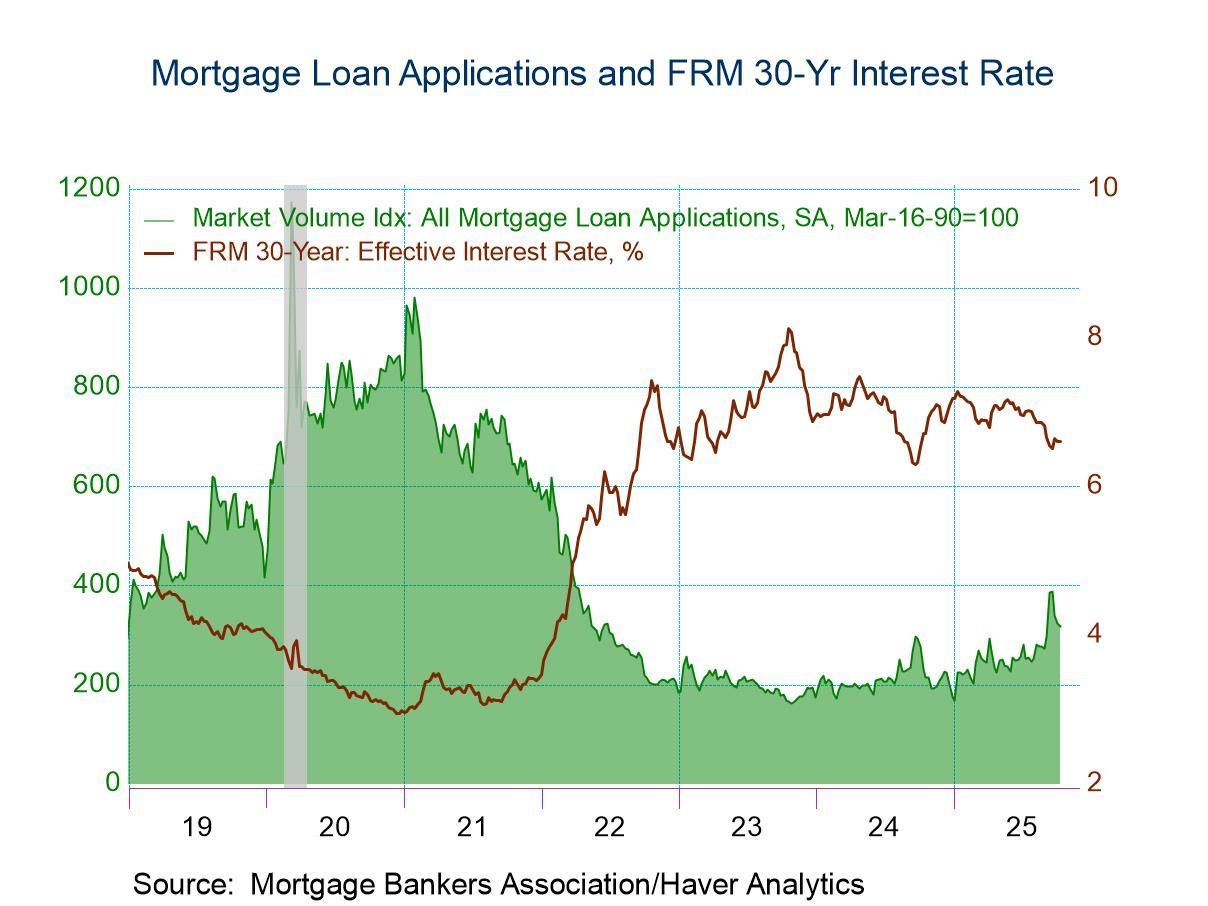
U.S. Mortgage Applications Continued to Fall in Latest Week
- Mortgage applications fell 1.8% w/w in the week ended October 10, the third consecutive weekly decline.
- Applications are on a modest uptrend but are still correcting from the outsize jump in mid-September.
- Fixed mortgage rates were mixed with the 15-year rate down slightly and the 30-year rate unchanged.
by:Sandy Batten
|in:Economy in Brief
 Europe| Oct 15 2025
EMU IP Sinks in August
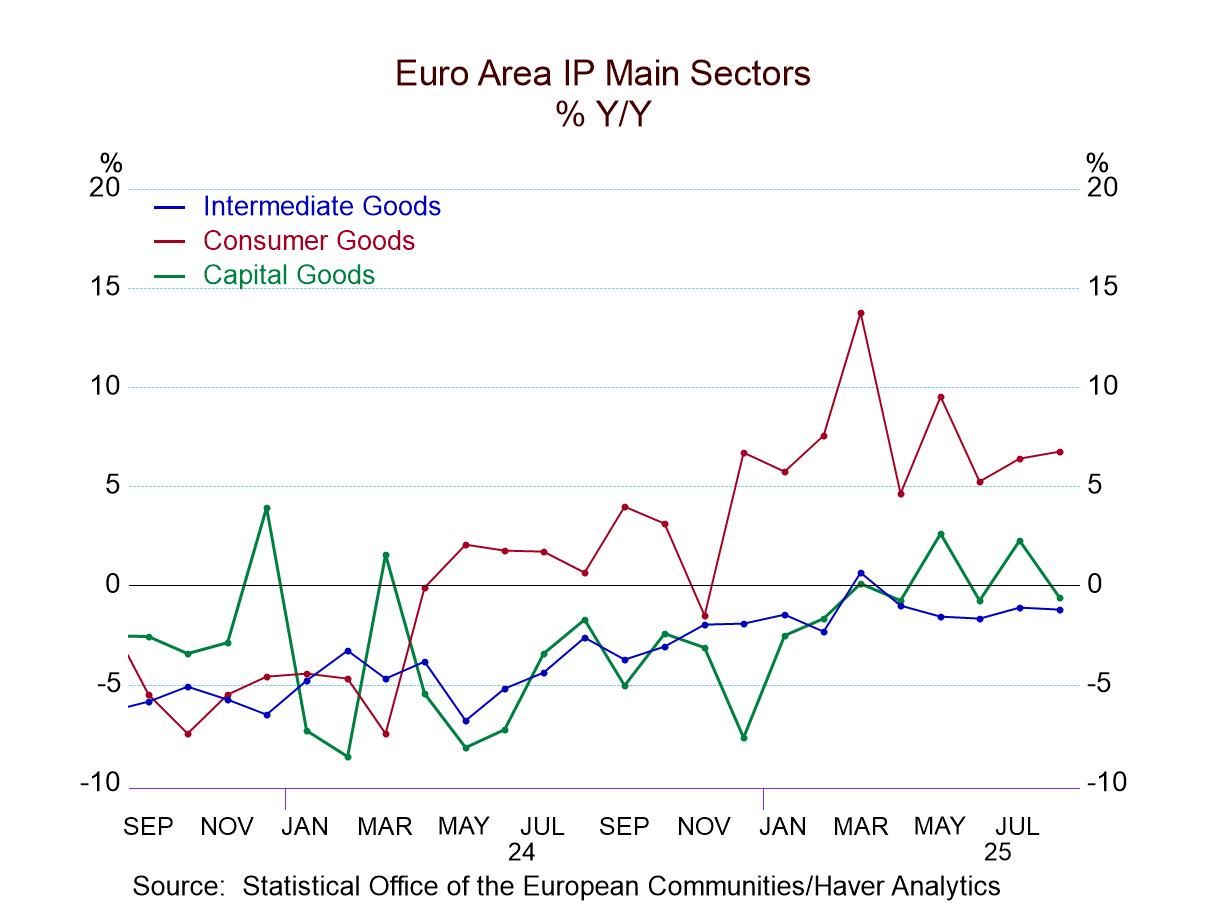
Industrial output in the European Monetary Union fell by 1.2% in August after rising by 0.5% in July. Manufacturing output followed these trends as well, falling by 1.2% in August after rising 0.8% in July. Sequential growth rates from 12-months to six-months to three months show a deteriorating trend with 12-month growth up by 0.5%, six-month growth falling at a 1.6% annual rate, and three-month growth falling at a 5.9% pace. Manufacturing largely follows the same pattern with a 12-month increase of 0.8%, a six-month decline at a 1.2% annual rate, and a 3-month decline at a 5.1% annual rate.
In the quarter to date, both overall industrial production and manufacturing industrial production are falling.
Turning to sectors, most sectors posted declines in August with the exception being consumer nondurables where there was an increase in output of 0.1%. This is in sharp contrast to July where, despite a small increase in output, there were increases in output for manufacturing and for overall for consumer goods as well as strength for consumer durables. Consumer nondurables, intermediate goods, and capital goods in July revealed a very good month. However, industrial production was following that up with an August that is unwinding most of that rebound. However, for June, the month prior to July, they also had widespread declines with declines in every single sector except intermediate goods where output was flat. These conditions leave us with trends for manufacturing that are decelerating as noted above led by decelerations in consumer goods output. Intermediate goods and capital goods break with this pattern as intermediate goods show declines over 12 months and six months but log that 0.9% increase in output over three months; for capital goods there are declines in output over 12 months and over three months with the sharp decline over three months in between over six months there was a very small increase of 0.4%.
The final column presents year-to-date percentile standings based on 12-month growth rates. The overall growth rate for industrial production as well as manufacturing log rankings only in their 40th percentile, below their respective median for the period. Consumer goods, however, log a strong increase and post a 95th percentile standing, led by a 95.9 percentile gain for consumer nondurables. Capital goods, an important sector for the monetary union, has only a 27.5 percentile standing.
Across countries- Rankings for manufacturing across countries are also relatively weak with 7 of 13 of the country's logging rankings that are below their 50th percentile; Spain, Austria and Belgium have rankings above their 45th percentile putting them closer to a ranking that would be a median ranking that occurs at the 50th percentile mark. Two of the countries with increases above, but it's also true that 50th percentiles have only a 50.9 percentile and a 51.8 percentile standing and those countries have France and Italy. Luxembourg shows the manufacturing sector with growth in its 95.9 percentile. Ireland and Portugal post growth rates in their 80th percentile with Malta posting with growth rate in a 71.6 percentile. There's no significant strength in any country with size in the monetary union.
Finally, on a quarter-to-date basis, eight of the countries show declines with two months of data for the quarter.
This report continues the string of disappointing reports for growth and industrial output. The monetary union report shows little to spur optimism.
 USA| Oct 14 2025
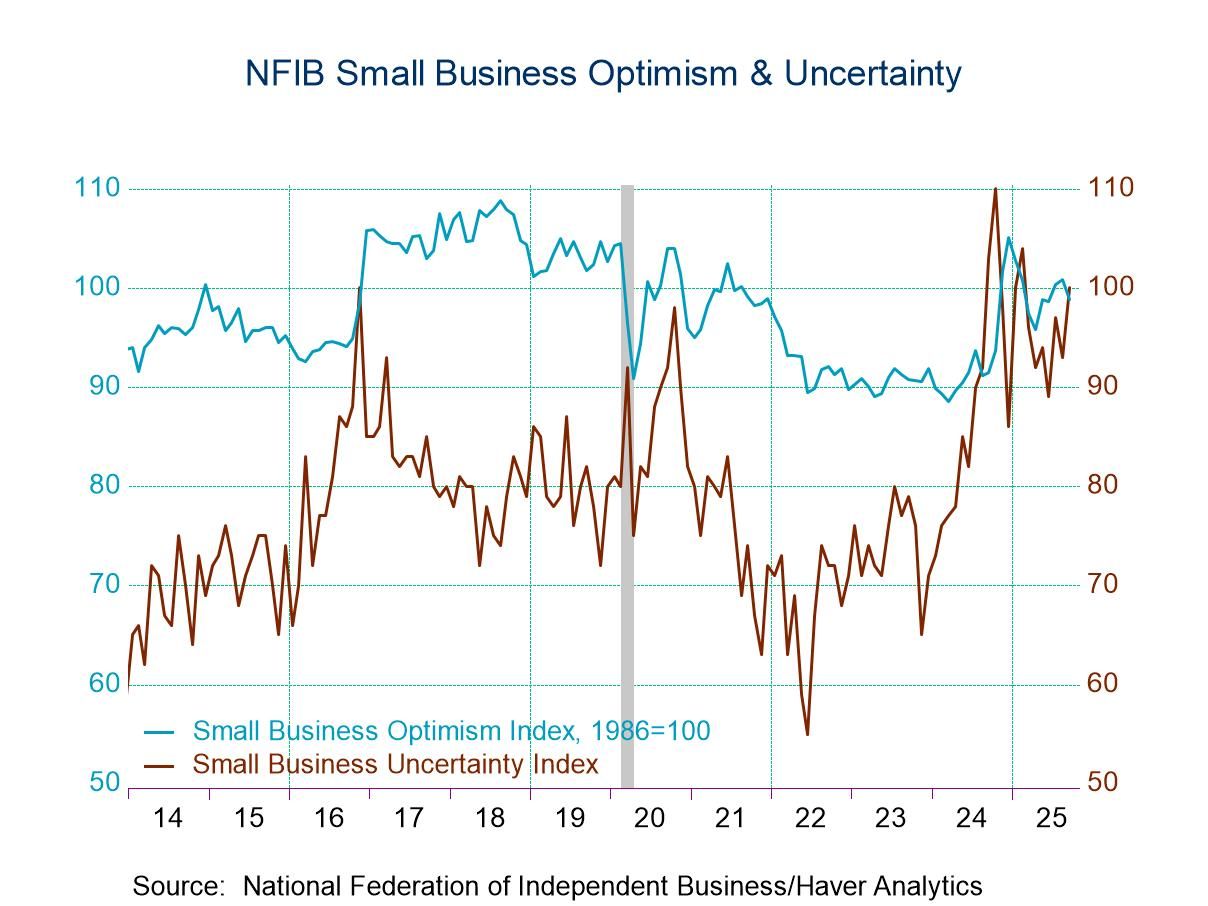
U.S. Small Business Optimism Fell in September
- First decline in three months.
- Uncertainty rose to the fourth highest levels in series history,
- Percentage expecting economy to improve fell for the third time in the past four months.
- Percentage reporting supply chain disruptions jumped 10 points in September.
- This survey was conducted in September. Whatever impact the federal government shutdown will have will appear in the October survey.
by:Sandy Batten
|in:Economy in Brief
 USA| Oct 13 2025
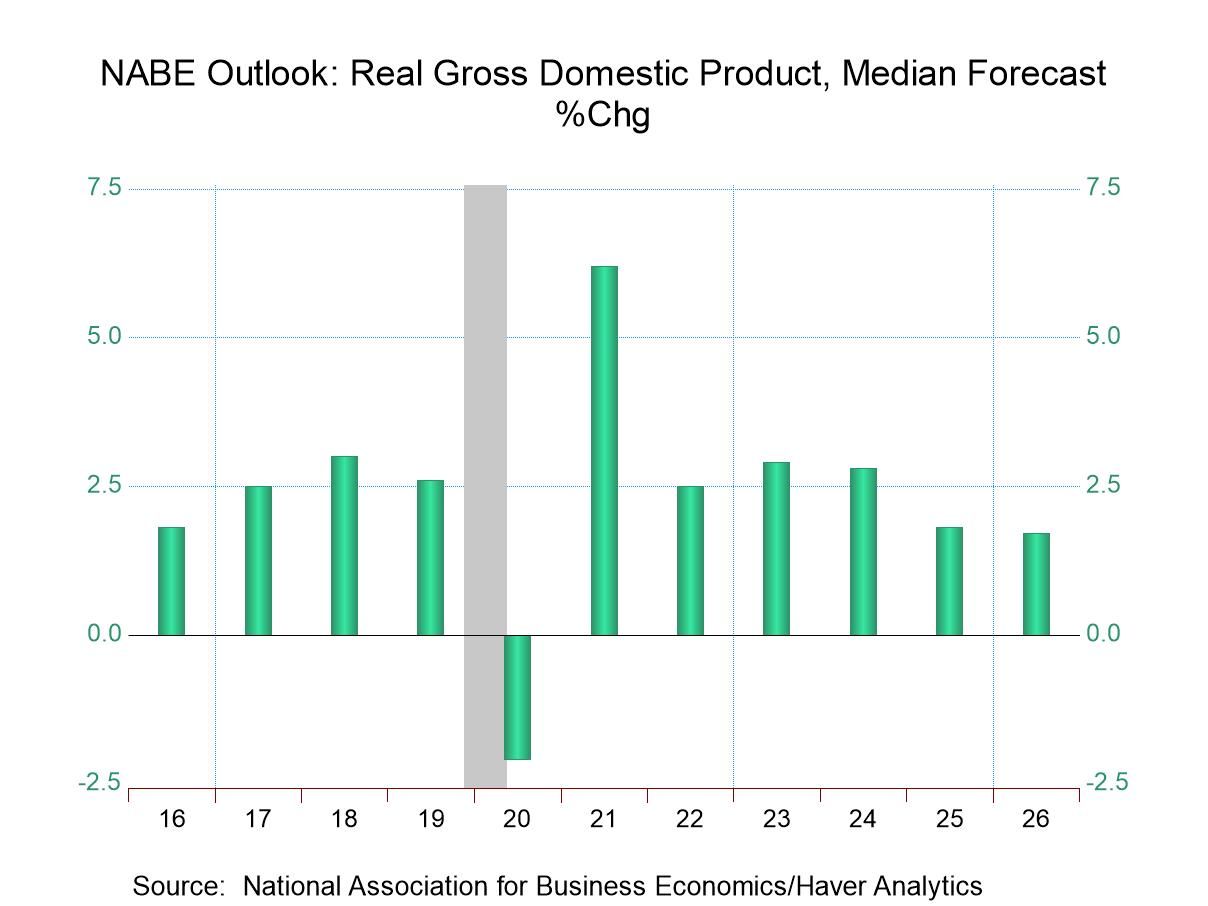
NABE GDP Forecasts In 2025 & 2026 Are Raised
- Consumer spending growth increased.
- Business investment growth also increased.
- Price inflation expectations reduced.
by:Tom Moeller
|in:Economy in Brief
 Asia| Oct 13 2025
Economic Letter from Asia: Gotta be Golden
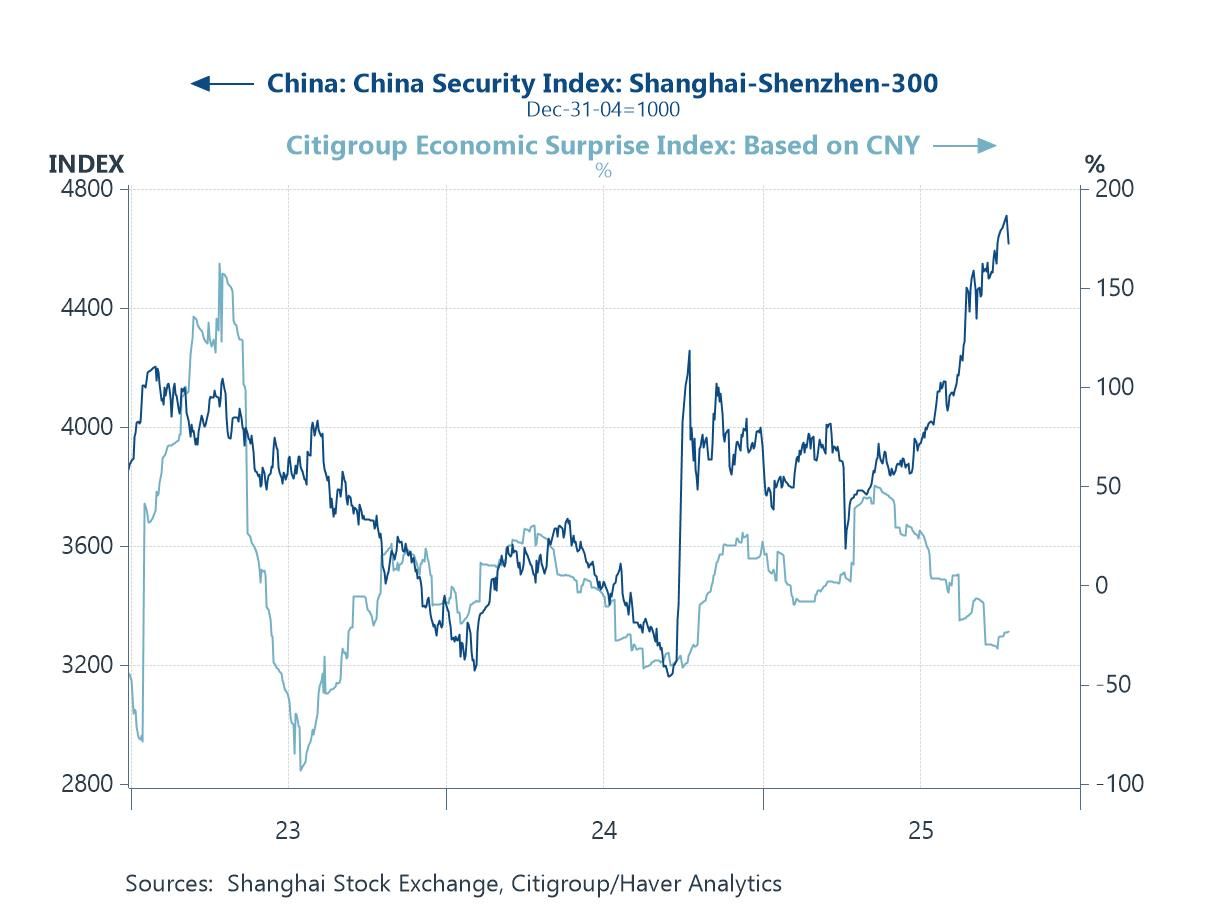
This week, we highlight recent developments in China and Japan, alongside movements in gold and their relevance to Asia. Investors remained broadly unfazed after China’s “super golden week” holidays, with equities buoyed by AI optimism despite recent weak economic data (chart 1). US President Trump’s Friday threats of additional 100% tariffs, however, dented sentiment, with the escalation underscoring China’s delicate external environment. This week’s trade figures show a continued divergence, with exports to Asia still growing while those to the US slumped further (chart 2), amid a backdrop of subdued domestic inflation. Attention is also on the IMF’s upcoming economic forecasts for China. Past projections, including the IMF’s July WEO and the World Bank’s recent report, suggest sub-5% growth, though late-year stimulus has sometimes lifted growth above expectations (chart 3).
In Japan, Sanae Takaichi’s victory in the LDP leadership race positions her to become the country’s first female Prime Minister. Yet, the exit of long-time coalition partner Komeito has left much uncertain. Nonetheless, markets have priced in Takaichi’s pro-growth stance, with a weaker yen and rallying equities (chart 4), though rising inflation (chart 5) may constrain policy ambitions. As for gold, the precious metal continues to attract attention, with prices surpassing $4,000 per ounce. The rally has strengthened Asian currencies that are usually correlated with the precious metal, such as the Thai baht. A slower-moving but significant driver of the gold rally remains the accumulation of reserves by major Asian central banks, including China and India (chart 6), likely reflecting efforts to diversify away from the US dollar.
China China has just come out of its “super golden week”, an eight-day stretch of consecutive holidays from October 1st to 8th, resulting from the overlap of the National Day and Mid-Autumn Festival breaks. This extended holiday period was closely watched for a potential spike in domestic tourism, retail spending, and broader growth momentum. Preliminary data show that key retail and catering firms recorded a 2.7% y/y increase in sales, a notable slowdown from the 6.3% growth seen during the Labour Day break earlier this year. This suggests that consumer spending was more restrained during the recent holiday period. Given Beijing’s increasing emphasis on consumption-led growth over traditional drivers such as exports and investment, the health of Chinese consumers has become an ever more critical barometer of the economy. Nonetheless, following the reopening of financial markets after the holidays, equity market enthusiasm — buoyed in part by AI optimism — initially appeared undimmed, despite a weaker run of economic data (chart 1).
- of2693Go to 26 page