Haver Analytics
Haver Analytics

Economy in Brief

  • German orders fell in April when an increase had been expected; the decline in March had been revised to be larger and as a result the picture of German manufacturing had become bleaker in April.

    The run of data on German manufacturing for the month is quite negative with very little that could be regarded as a bright spot or a positive result. A close look at the graphic, however, shows that foreign real orders are on a gradual uptrend (for their y/y growth rate) and have poked up above 0 to post a positive growth rate over 12 months. There's even a positive growth rate over six months that's stronger, still. But then, over three months, all that goes away. German domestic order growth rates deteriorate and decelerate from -8.3% over 12 months to an annual rate decline of 9.6% over six month to an annualized drop of 10.4% over three months. The headline for orders shows declines, hovering at 1.2% to 1.3% at an annual rate over 12 months and six months and then plunging at a 7.7% annual rate over three months. The year-over-year growth rate is poor, the trend in the shorter growth rates is poor, and the historic comparison shows a year ago drop of 10.9%. German orders have been weak for quite some time and that picture is continuing to paint on the same palette with the same colors looking ahead.

    Sector sales fell by 1% in April after declining by 0.3% in March and posting a 1% rise in February. For manufacturing, there's also a sequential deterioration, with a 1.1% gain in February, a 0.4% annualized drop in March and a 0.9% annual rate drop in April. Sequential growth rates, however, from 12-months to six-months to three-months show the pace of decline for real sector sales diminishing for the overall metric as well as for all manufacturing sales. That's a little bit of good news, but those statistics still show overall real sales falling at a 1.2% annual rate over three months and manufacturing sales falling at 0.8% at an annual rate over three months.

    Industrial indicators from the EU Commission in April all post negative numbers. In April, the metrics weakened in Germany, France, and in Italy but they strengthened slightly in Spain, compared to their March result. Sequentially the negative German numbers get progressively weaker from 12-months to six-months to three-months. The figures for France get slightly better, improving from a -8.2 reading over 12 months to a -5.6 reading over three months. Italy’s results vacillate between -6.5 to -7. Spain’s readings progressively improve from -6.9 over 12 months to a six-month average of -6 to a three-month average of -4.9. For the industrial data, we calculated queue standings that rank the April values in their historic queue of numbers back to 1990. On that basis, the German figures are the weakest of all with the 12.5 percentile standing, Italy has a 26.9 percentile standing, France has a 39.9 percentile standing; only Spain has a standing above its historic median, but the queue value of 52.9% is barely above the threshold of 50 that identifies where its median is located.

    Quarter-to-date readings show us where the April figures reside in growth terms relative to the first quarter average results. German total orders, foreign orders, and domestic orders all are declining with the larger decline coming out of domestic orders at -12.6% at an annual rate. Real sales are declining at a 5.2% annual rate, with manufacturing sales declining at a 4.8% annual rate.

    • Increase reverses April’s sharp decline.
    • Business activity index surges while orders & employment rise.
    • Prices index slips.
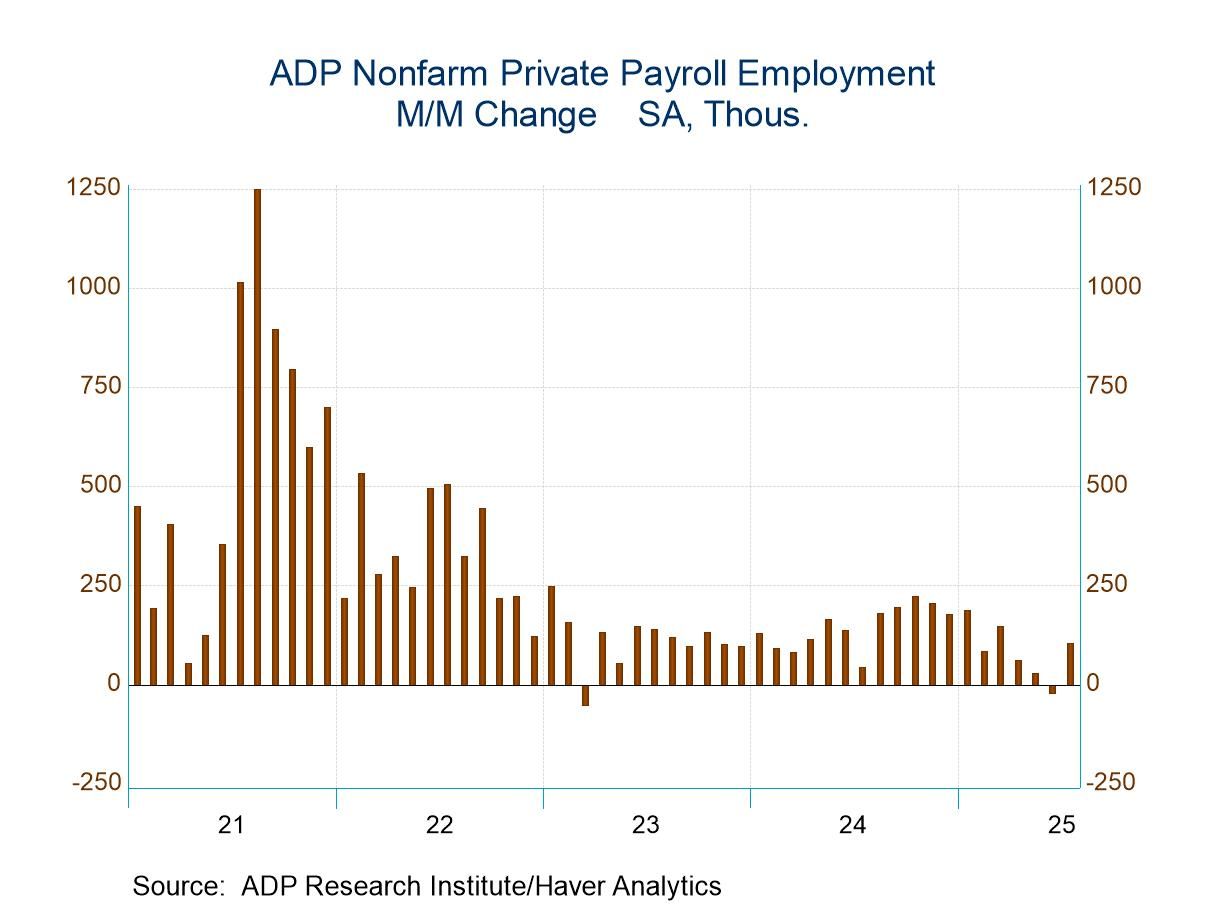
    • Job increase weakest in four months; factory jobs decline.
    • Service-sector & construction sector job growth steady & strong.
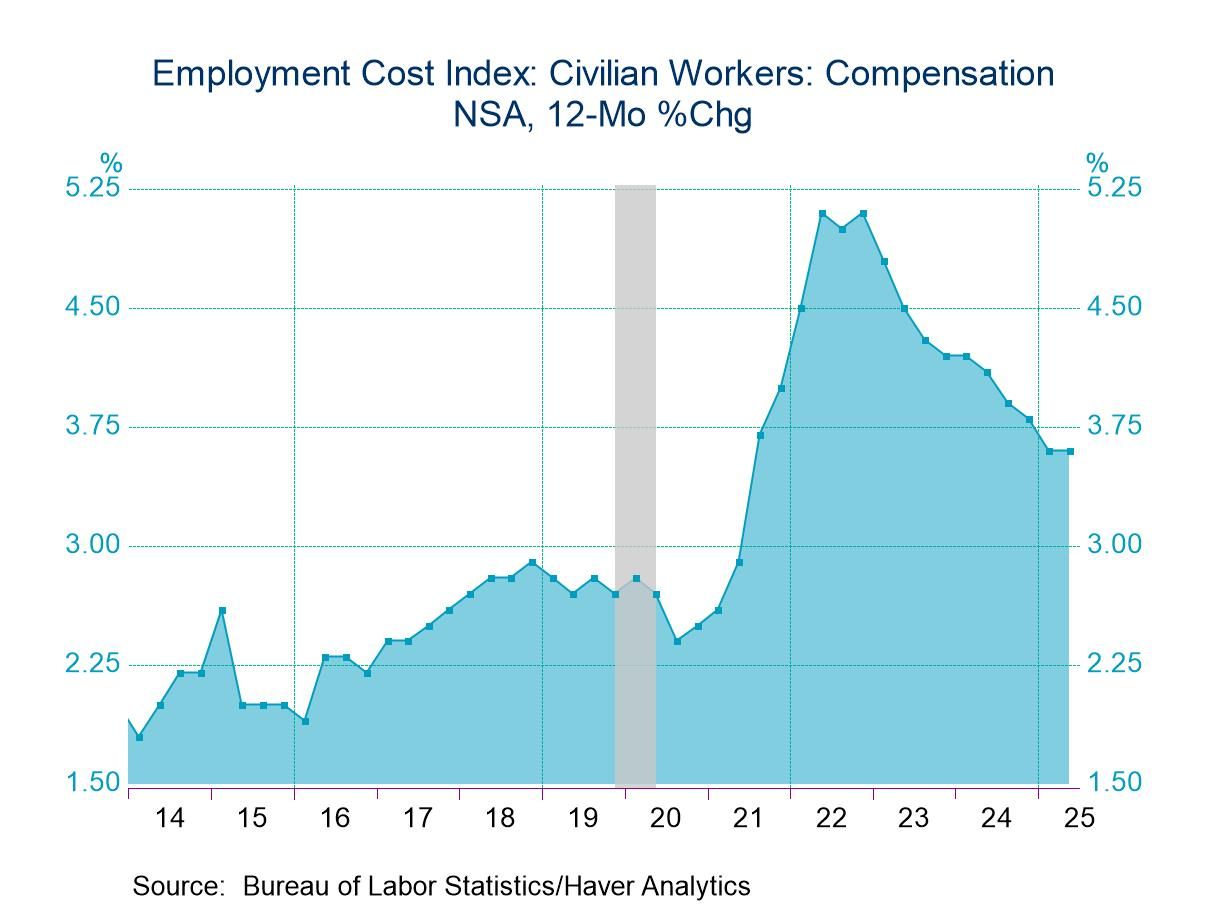
    • Wage growth for “job stayers” steady y/y.
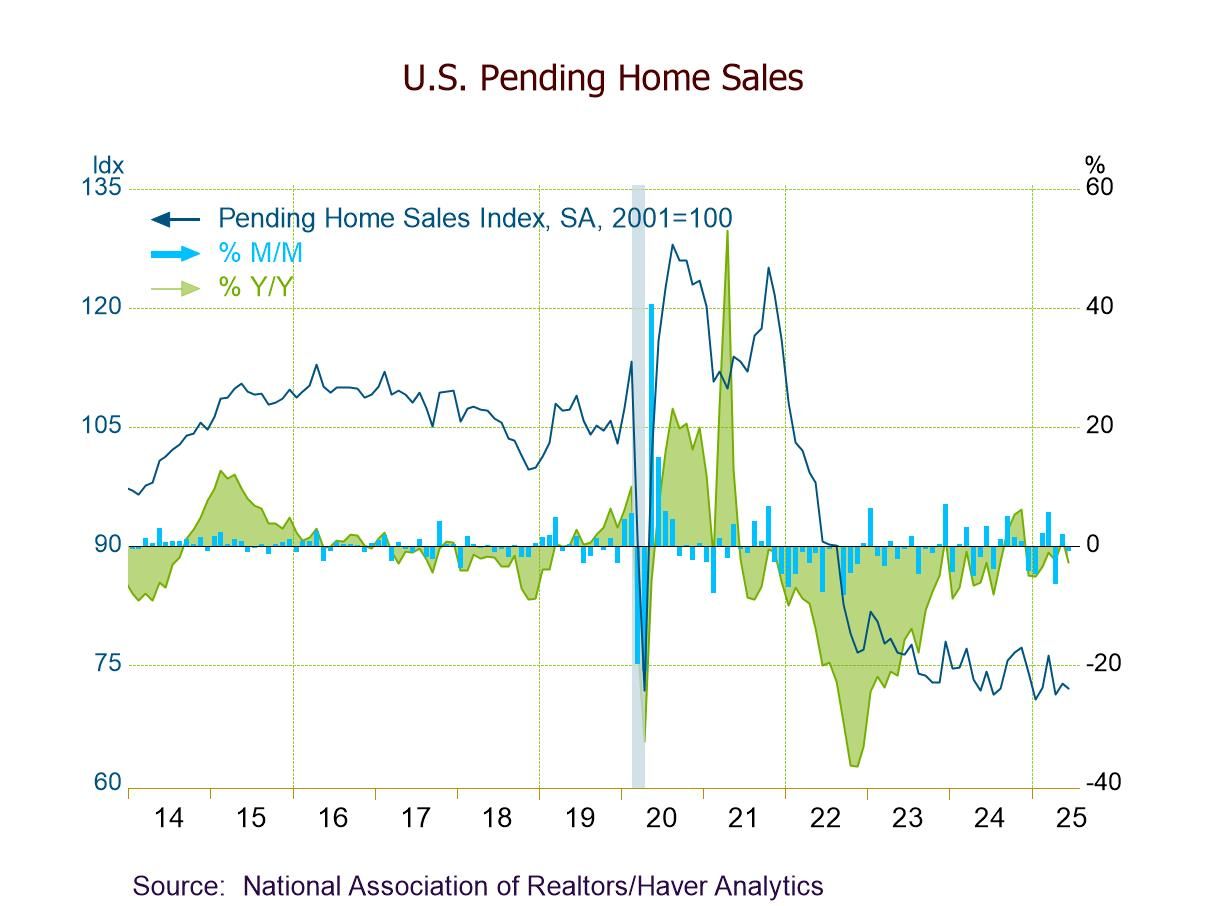
    • Drop in mortgage applications for the second week after three weekly increases.
    • Purchase & refinancing applications both declined.
    • Effective 30-year and 15-year fixed interest rates move higher.
  • Composite PMIs are back to showing more places indicating improvement month-to-month. Only 40% of these 25 reporters have PMI values that weakens month-to-month up from 56% weakening in April. But there is an overpowering tilt of reporters showing expansion compared to contraction with only 4 reporters out of 25 showing contraction (Composite PMI<50) in May, the same as in April; March, has 6 reporters below 50.

    Over 12 months more show weakening compared to a year ago, as 70% of reporters have PMIs below 50. But over six months that count is reduced to 34.8%, and over three months only 30% show weakening jurisdictions.

    Contraction has been slightly more common over three-, six-, and 12-month periods, with 6-showing contraction over three months, 9-showing contraction over six months and 11-showing contraction over 12-months.

    The percentile standings that are a completely different animal- they show the ranking of the PMI gauge over the last four years (to May 2020) compared to past performance. The 50% mark in the queue standing reflects the median value for each jurisdiction over the last four years. Ten of 25 jurisdictions are below their median performance in May. There is still a lot of under-performance.

    The composite PMIs this month come of the heels of the release of the service sector PMIs that have values above 50 for all reporting participants except Russia. However, not all countries report services and manufacturing separately. Among the ten who report separate service sectors, seven of them showed growth erosion in May compared to April. So monthly PMI improvements are laid at the feet of manufacturing sectors or countries that do provide separate service sector status.

    Smaller developing countries are struggling the most. The summary data show slight but steady increase in the average PMI that stands at 52.8 in May – above its three-month average. The median weakens over six months then rebounds above its 12-month average over three months as well as in May. The BRIC-3 (BIC? -excluding Russia) has the highest PMI average in the table at 56.2 in May. The U.S., U.K. and EMU are at 53.3, above the all-average and all-median. So, it’s the smaller economies that bring the averages lower. In May, Zambia, Egypt, and Hong Kong have PMIs below 50. France also has a PMI reading below 50. Apart from these, PMI reading below 52 are found in May for Kenya, Ghana, Sweden, and Russia (Ireland uses the reading from April that is below 52). On the strong side, May readings over 54 are featured in the U.S. (54.5), Spain (56.6), India (60.5), Saudi Arabia (56.4), UAE (55.3), Singapore (54.2), and China (54.1).

    In terms of relativity, the queue standings for the BRIC-3 are at 76.5%, the All-average is at 56.7%, the U.S., U.K. and EMU are at 55.8%, and the All-median is at 55.1%. All these groupings show PMI values above their four-year medians. For those countries not included in any of those groups, the average queue standing is 54.4% and the median queue standing for them is 48%, their queue standings average below medians when pooled.

    • Openings remain well below 2022 high.
    • Hires improve slightly m/m, but are sharply lower y/y.
    • Quits rebound.
    • Manufacturers’ new orders +0.7% (+1.3% y/y) in April; +0.7% (+1.5% y/y) in March.
    • Durable goods orders (0.6%), nondurable goods orders (0.8%) and shipments (1.0%) rise for the third consecutive month.
    • Unfilled orders increase 0.2% after a 0.3% March gain.
    • Inventories edge up 0.1% after holding steady.
    • Gasoline & diesel fuel prices continue to weaken.
    • Crude oil costs add to earlier declines.
    • Natural gas prices fall sharply.