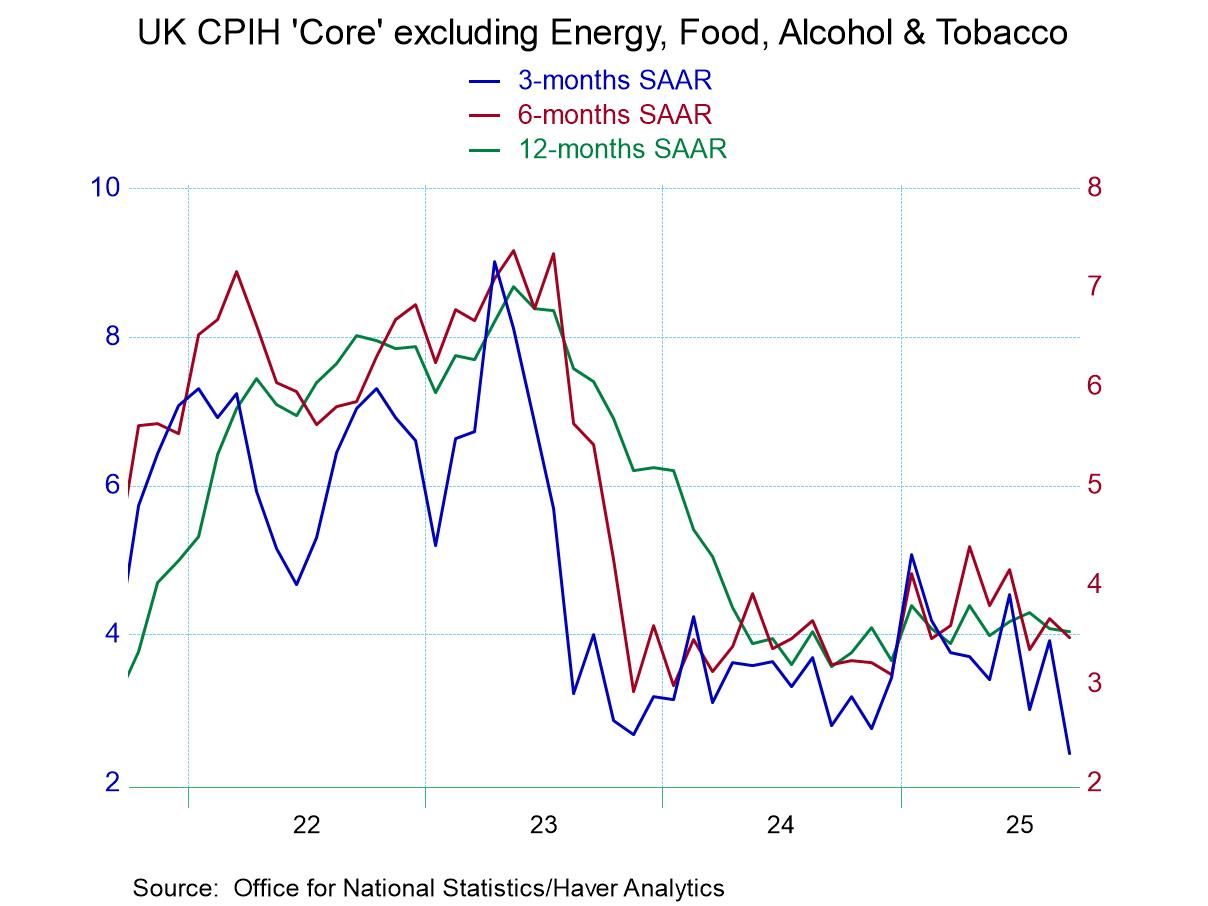
Inflation in the UK rose by 0.1% according to the CPI headline in September. This was a step down from the 0.3% increase in August. The core CPI-H (excluding, energy, food, alcohol, and tobacco) rose by 0.2% in September, the same as in August and in July. Sequentially the CPI-H rose 4.1% over 12-months, rose at a 3.8% annual rate over six-months, and rose at a 3.3% annual rate over 3-months for the headline CPI-H. That marks a clear decelerating pattern from 12-months to 6-months to 3-months. That same phenomenon is reproduced by the core, where the year-over-year inflation rate is 4% ,the 6-month annual rate drops to 3.5%, and the 3-month rate drops again to 2.7%.
This is good news for the UK. Inflation has been excessive for quite some time. The Headline and core metrics showed year-on-year gains of 2% or less last in July of 2021 a period of over four years. The chart at the top of this report shows the sequential inflation rate plotted for the core CPI-H. In plotting that I'm plotting the measure that looks the best because the headline CPI-H does not decline anywhere near as much as the core does. However, since the core is more permanent and less fickle in its trend it's probably the better way to look at inflation in the UK as well as at the progress being made and to think about the policy options.
The diffusion calculation by month which looks at the categories and looks at the percentage that are accelerating versus decelerating, shows only 9% of categories accelerating in September, 45% accelerated in August, and 45% accelerated in July. That means for the last three months the monthly categories were generally showing lower inflation across most categories than they had in the month before.
The table also replicates diffusion calculations for 12-months, 6-months, and 3-months; in each case diffusion is compared to the previous period on the table. 12-month inflation accelerates in 45% of the categories compared to a year-ago 6-month inflation accelerates in only 27% of the categories compared to the 12-month horizon while over 3-months only 18% of the categories accelerate compared to 6-months. Once again, these categories show us that inflation is decelerating broadly across these categories underpinning the sense of good news that we see in both the headline and in the core as each is showing inflation on a decelerating profile.
Meanwhile, on the unemployment front, the UK unemployment rate is mildly rising from a 4.1% rate 12-months ago to 4.4% 6-months ago to 4.7% 3- months ago. The most up-to-date reading on the unemployment rate is for July and that's a reading of 4.8%. The unemployment rate has clearly been creeping up and that 4.8% has about a 40th percentile standing in the queue of data on unemployment back to early 2000. The unemployment rate standing is still below its median however it's beginning to creep up. The claimant rate of unemployment is slightly more up-to-date as we have a figure as of August. Even though the claimant rate is lower than the unemployment rate, historically it has usually been lower so that the percentile ranking of that rate is actually much higher than for the overall unemployment rate at 71%. That is a bit more disturbing.
Still, if we rank inflation in the UK as of September the year over year inflation rate compared to where inflation has been since early 2000, that rate ranking continues to be a high. At the level of 4.1% year-over-year rate translates into 87 percentile standing while the 4% core rate translates into an 85-percentile standing. Only two categories and the CPI-H have standings below their 50th percentile; one is for furniture household equipment & maintenance and the other category is miscellaneous goods and services.
How we view inflation in the UK has a lot to do with which of the profiles we really want to look at to be the policy focus. If we insist on looking at year-over-year inflation the inflation is still too high and stubborn, however, if we look at the 3-month inflation rates, inflation is much lower and making much better progress toward the Bank of England's goals. Economic data have been weakening that's something that could push the Bank of England toward rate cuts even with the excessive inflation numbers that it's printing because it makes the economy seem to be slipping into a period of weakness. In that event, the BOE might expect that the period of weakness will do a lot of ‘the work’ in terms of getting the inflation rate lower.
This is going to be something to watch and the upcoming weeks not just as the Bank of England prepares for its next meeting but farther than that is it assesses whether it’s concerned about reducing inflation now or whether it thinks that growth is already on a reduction path that will allow it to shift gears and try to cushion the economy as it slows down. The Bank of England is facing a policy dilemma and it will bear watching to see which prong of the dilemma it chooses to emphasize
 Asia
Asia