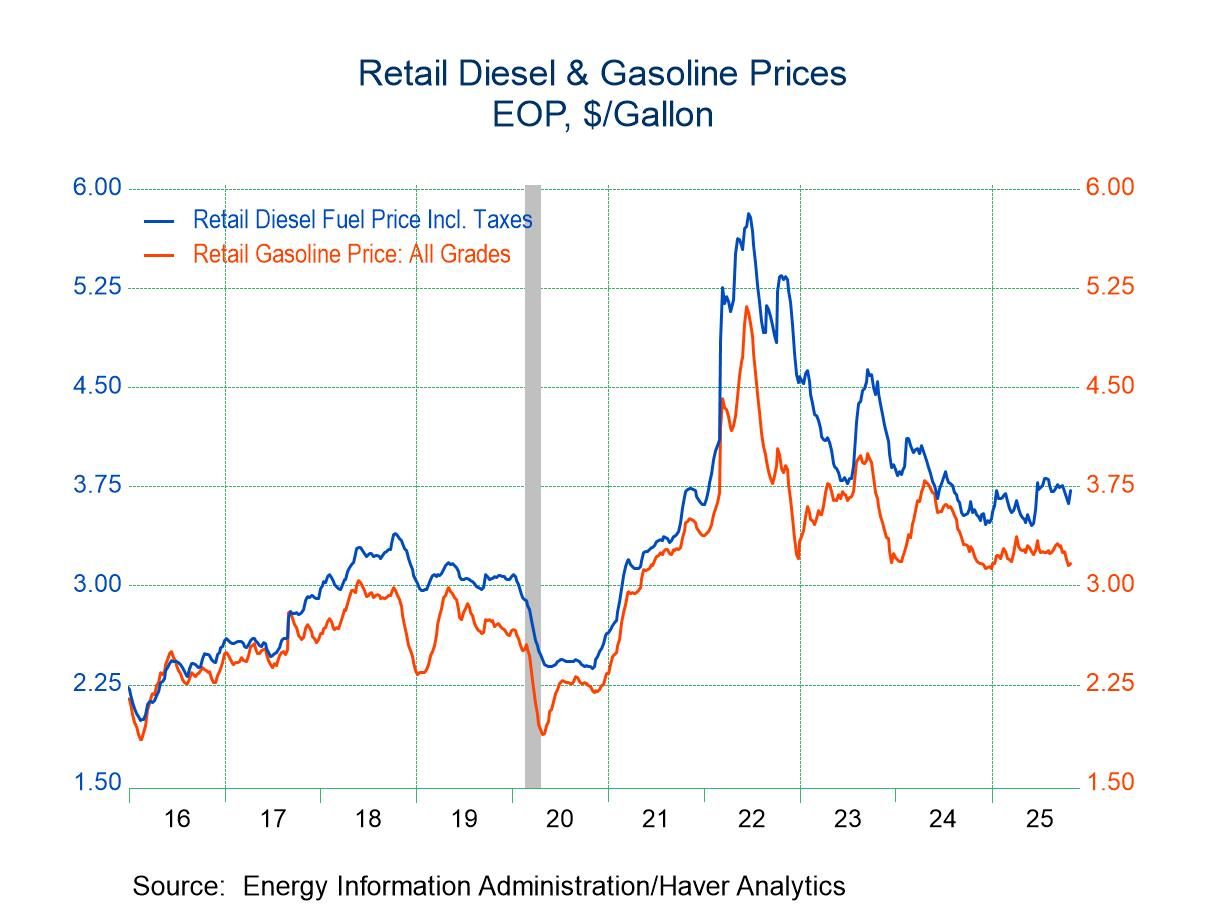
- Gasoline prices edge higher.
- The price of WTI crude oil improves.
- Natural gas prices rebound.
 USA| Oct 28 2025
U.S. Energy Prices Rise in Latest Week
by:Tom Moeller
|in:Economy in Brief
 Europe| Oct 28 2025
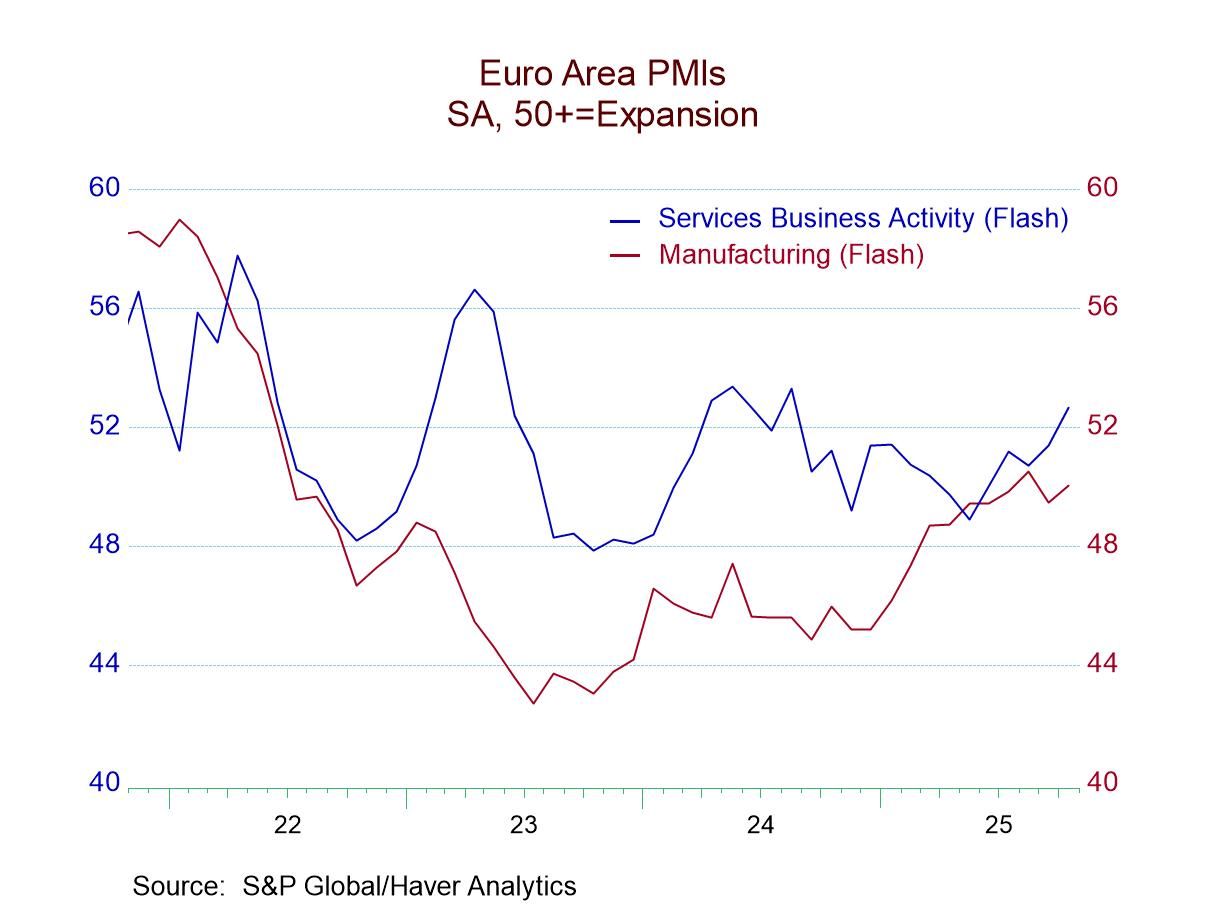
Composite PMIs Mostly Improve in October
An upswing appears to be underway with both manufacturing and services readings improving. The S&P PMI data for October covered eight different reporters, five of which improved in October compared to September. September had been an extremely weak set of readings; out of the 24 different categories (eight countries with three readings each), there were only five that improved in September compared to August. August had been a strong month. The survey clearly is showing some volatility over these past few months; however, in October we're seeing a fairly broad-based increase, with only nine of the 24 detailed categories that assess the composite, manufacturing, and services showing weaker performance compared to September. And of those comparisons across eight countries, 19 sectors and composite indexes had been weaker month-to-month in September compared to August.
Over three months the averaged composites are stronger compared to six-month average. Among all the reporters, only three of the 24 sectors and composite readings show weakness in three-months compared to six-months. Each of those weakening readings is for manufacturing. They involve weaker manufacturing in Japan, in Australia, and in the United States. Ten of 24 sectors and composite readings weaken over six months compared to 12-months. Only 7 detailed readings out of 24 weaken over 12 months compared to 12-months before based on comparing averages.
Queue percentile standings take the October values and rank them in a queue of data back to January 2021 expressing the standing in October as a percentile in that queue of readings. The average percentile standing for the composite indexes in October is at 55.6%. The average manufacturing sector’s queue standing at 52.2% while the average services rating is at 54.1%. In October, all of the readings averaged across the 8 reporters are above their medians for the period back to January 2021 compared across monthly data. That's not an exceptionally strong performance, but it's a solid performance. Among the reporting countries, only Japan, the United Kingdom, and France have composite standings that are below their medians (that is, they have ranked standings for their respective composites below their 50th percentile).
The average standing across the 8 reporters in October generally shows an improvement from September; September was weaker than August. With that, October values, while higher month-to-month, were lower than they were in August. For example, the overall composite in October moved up to 52.8 from 52.5 in September, but September had fallen from 53.9. Values in October are still below values in August. The same thing is true of services and manufacturing.
The average sequential data for 3-months, 6-months and 12-months, however, show steady improvement with composite readings rising from 51.8 for 12-months to 51.9 over six months and to 52.6 over three months. These calculations are performed only on hard data and are up to date through September. The October monthly reading for the composite, for manufacturing and for services are stronger for each of these readings in October compared to three-month averaged values ended in September paving the way for continued improvement ahead.
Overall, the sense of improvement here is slow. Compared to January 2021, the October readings are stronger for composite and for services but weaker for manufacturing; that sector is taking longer to recover. Still, recovery seems to be in gear; if that remains the case, central banks may have to rethink their programs of ongoing interest rate cuts.
 USA| Oct 27 2025
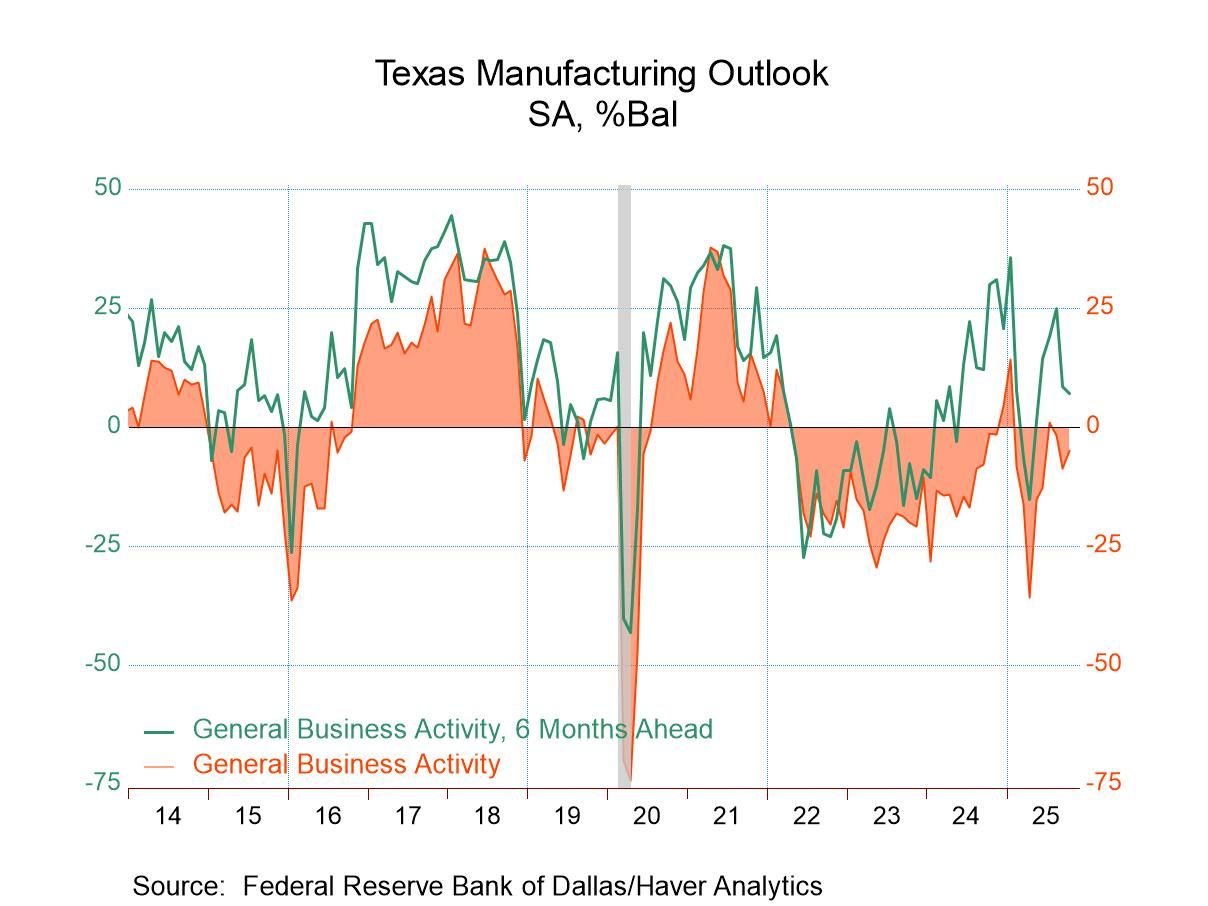
Texas Manufacturing Activity Index Remains Negative; Expectations Deteriorate in October
- Current Conditions Survey is negative for eighth month in last nine.
- Production, new orders, shipments & employment stay sluggish.
- Wages & benefits weaken; prices ease.
by:Tom Moeller
|in:Economy in Brief
 Finland| Oct 27 2025
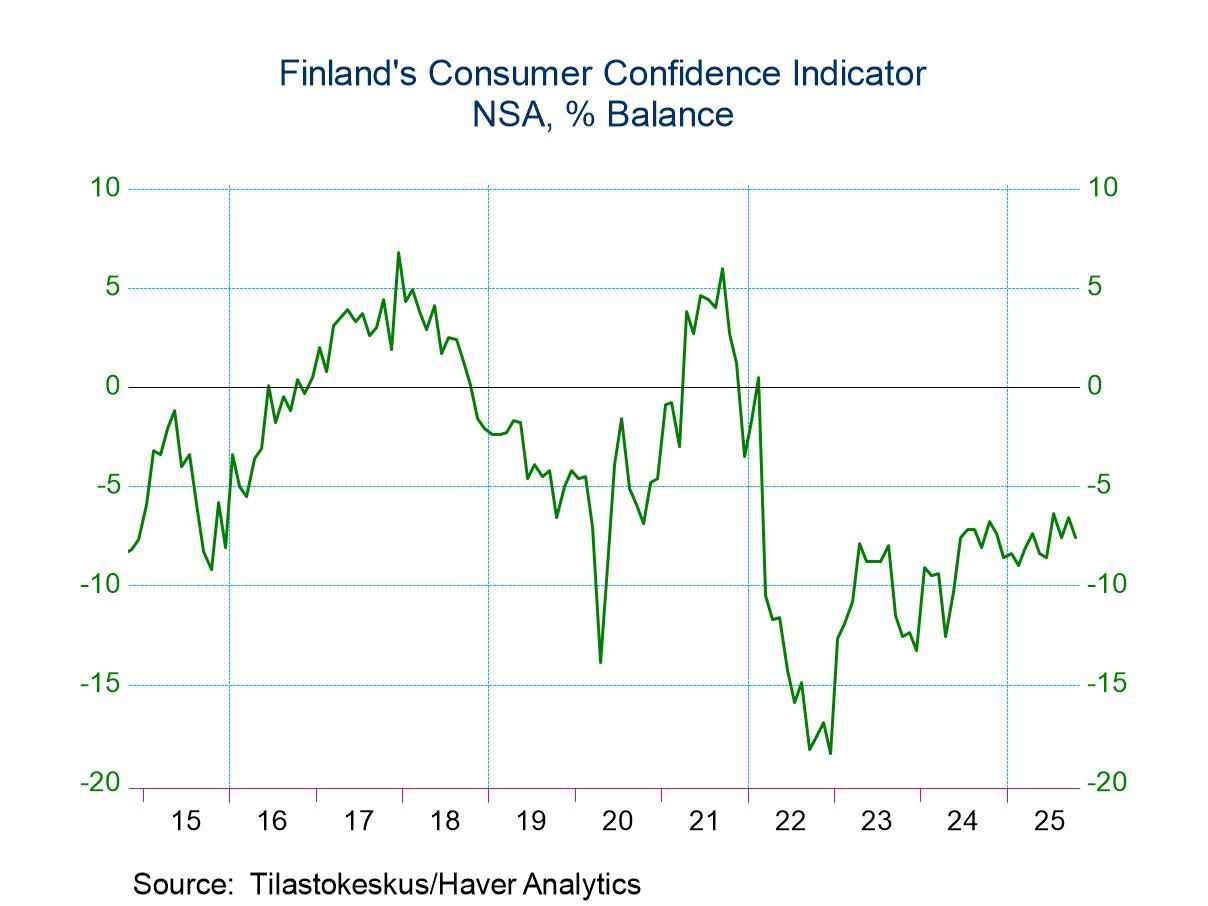
Finland’s Consumer Confidence Backs Down for One Month
Consumer confidence in Finland slipped in October. The -7.6 reading was a slip from -6.6 in September, bringing it back to its August level of -7.6. The 12-month average for confidence is -7.9; the 12-month low is -9, so there hasn't been a lot of change in consumer confidence over the past year. Confidence currently is relatively firm compared to its recent range in its 12-month average even though it is slightly below that average. The queue ranking for the October level is at its 23.9 percentile, putting it in the lower quarter of its rank of data; one year ago, consumer confidence ranked in its 26th percentile. There's been a modest improvement in confidence over the past year. The rankings are executed over data back to 2002, a ranking over a period of roughly 23 years.
Macro and micro trends The microeconomic indicator for Finnish consumer confidence improved slightly in October, rising to 22.4 from September’s 21.8. At 22.4, it is slightly below its 12-month average, and it has a ranking of only its 11.2 percentile, which is a slippage compared to a 22-percentile standing one year ago. The macro indicator for consumer confidence slipped to -21.7 in October from -20.5 in September; it is slightly above its 12-month low at -23.3 and almost exactly on its 12-month average. The ranking for the macro indicator is in its 22nd percentile, nearly identical to what it was one year ago.
Some details In terms of the rankings, the Finnish consumer confidence survey is dominated by extremely low rankings. Most of them are lower 25th percentile or even lower; however, the index has some redeeming qualities. Among them is the fact that unemployment in Finland, although it deteriorated slightly in October to -30.1 from -27.8 in September, has only a 22.8% standing and it's lower than it was a year ago. People's perception of the personal threat of unemployment fell significantly in October to -17.1 from -12.5. in September; the ranking for that measure is in its 7.7 percentile, a very low ranking and is an improvement from the 17-percentile standing of one-year ago. Despite the weakness in the economy and the difficulties consumers are having in their assessments of confidence, they don't have any kind of fear and certainly not a growing fear of unemployment. That clearly is a silver lining in what we could regard as the dark cloud that dominates this report.
The assessment of the economy now slipped to -40.1 in October from -34 in September. The economy in 12 months is not assessed to be much different than it was a month ago and its ranking in October 2025 is substantially the same as it was one year ago (about a 30-percentiel standing). The assessment of consumer prices showed a slight reduction in inflation in October; however, the ranking of inflation is elevated at a 65.2 percentile standing that's above its historic median, but it's a substantial improvement from the 83-percentile standing of one-year ago.
The environmental assessments for the month of October showed a deterioration in the favorability the timed the purchase durables at a -16.6 reading in October compared to -12 in September. The favorability of saving was unchanged at -8.3 in September and October. The favorability of a time to raise a loan balance slipped to -29.4 in October from -25.3 in September; the household financial situation slipped slightly to 22.9 from 24; and the possibility to save over the next 12 months rose to 38.2 from 34.5. The rankings on these various metrics remained in the 12th or 13th percentiles for the purchasing, savings, and loan balance assessments. The household financial situation has a higher standing at a 27th percentile - still a nearly a bottom 25% standing. And the possibility to save over the next 12 months, while it improved in the month, has an 8-percentile standing.
Finland did not improve on the month; however, it shows trending toward better times and unemployment fears are low.
 Asia| Oct 27 2025
Economic Letter from Asia: To the Summit!
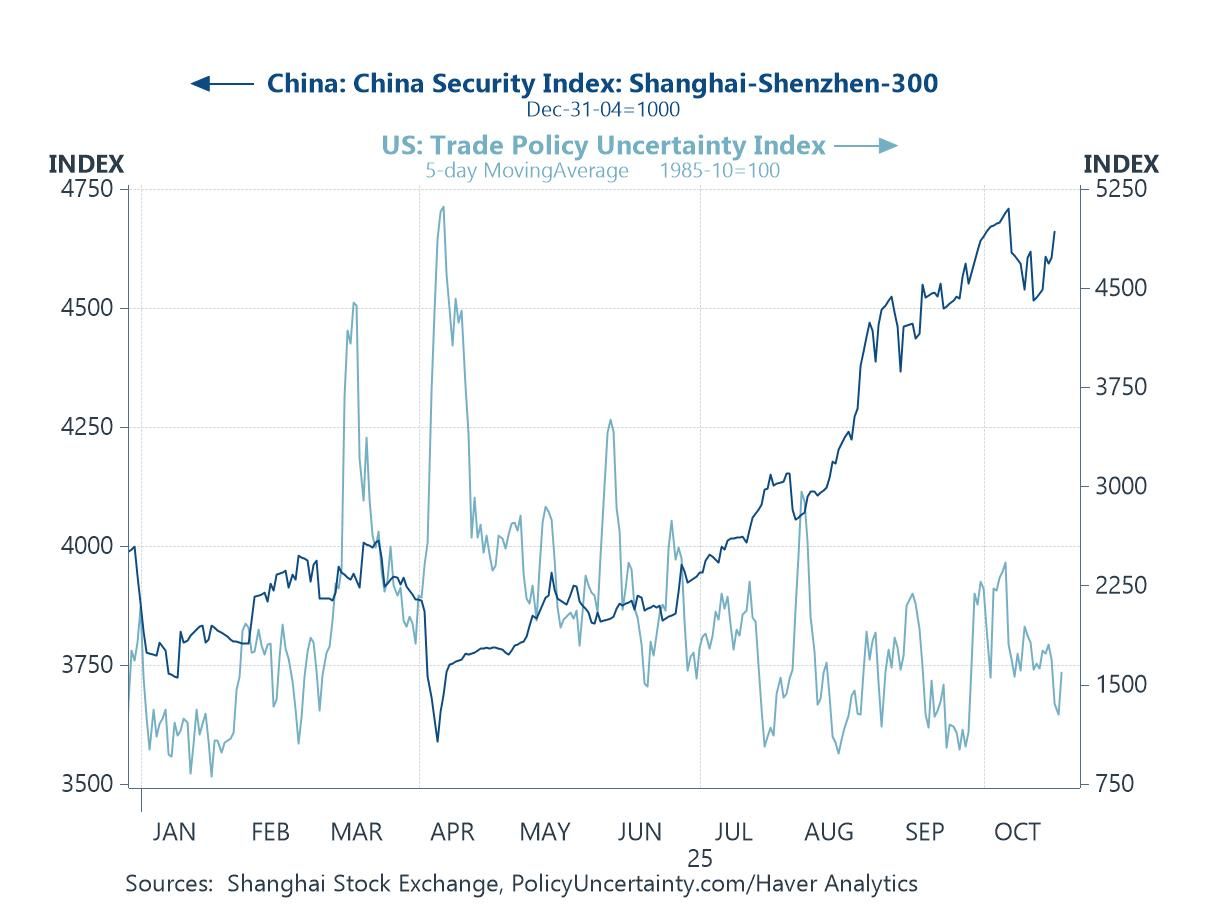
This week, attention remains on developments in Asia as US President Trump continues his regional tour. Over the weekend, his visit to Malaysia for the ASEAN–US summit saw a peace deal secured between Thailand and Cambodia, along with several trade agreements with ASEAN economies. Focus now shifts to Trump’s upcoming interactions with Japan’s new Prime Minister Takaichi and China’s President Xi in Japan and South Korea, respectively. A US–China trade deal is highly anticipated, which, if achieved, could boost market sentiment and reduce uncertainty (chart 1). Leading up to these meetings, encouraging Chinese data has emerged, including a significant improvement in industrial profits, suggesting that efforts to curb race-to-the-bottom price competition are beginning to show results (chart 2).
In Japan, apart from the Trump–Takaichi meeting, markets will closely watch the Bank of Japan’s October monetary policy decision (chart 3). While no change in policy rates is expected, the Bank’s updated forecasts will be scrutinized. Japan’s September trade numbers were encouraging (chart 4), but much depends on the US–Japan trade relationship. Still, Japan’s stronger shipments to other economies, if sustained, could help offset potential US-related headwinds. US–India trade talks also remain in focus, with India reportedly planning to reduce purchases of Russian crude oil—a recurring point of contention (chart 5). At the same time, while India has faced reduced imports from the US due to tariffs, increased shipments to other trading partners, particularly in Asia, highlight a broader trend of trade diversification. Finally, while the ongoing AI boom continues to support exports growth across several Asian economies, the risk of overreliance on semiconductor exports deserves emphasis. Some economies would not have recorded year-to-date export growth without the current AI-driven upcycle (chart 6).
The ASEAN and APEC summits Over the weekend, US President Trump arrived in Kuala Lumpur for the ASEAN–US Summit, where he oversaw the signing of a peace deal between Thailand and Cambodia. He also signed several trade agreements, including commitments by four ASEAN members to remove most—or in some cases all—tariffs on US imports, as well as deals with some members on critical minerals cooperation. While these developments are notable for ASEAN watchers, investor attention now turns to Trump’s next stops in Japan and South Korea. In Japan, focus will be on Prime Minister Takaichi’s first meeting with the US President, while in South Korea, markets will watch whether a long-anticipated US–China trade deal can take shape during the APEC summit. Recent signs of easing tensions—namely the likely suspension of Trump’s 100% tariff threats and China’s possible delay of rare earth export restrictions—could help temper regional uncertainty. This, in turn, may lift market sentiment, marking a welcome reversal from the caution seen in prior weeks (chart 1).
 USA| Oct 24 2025
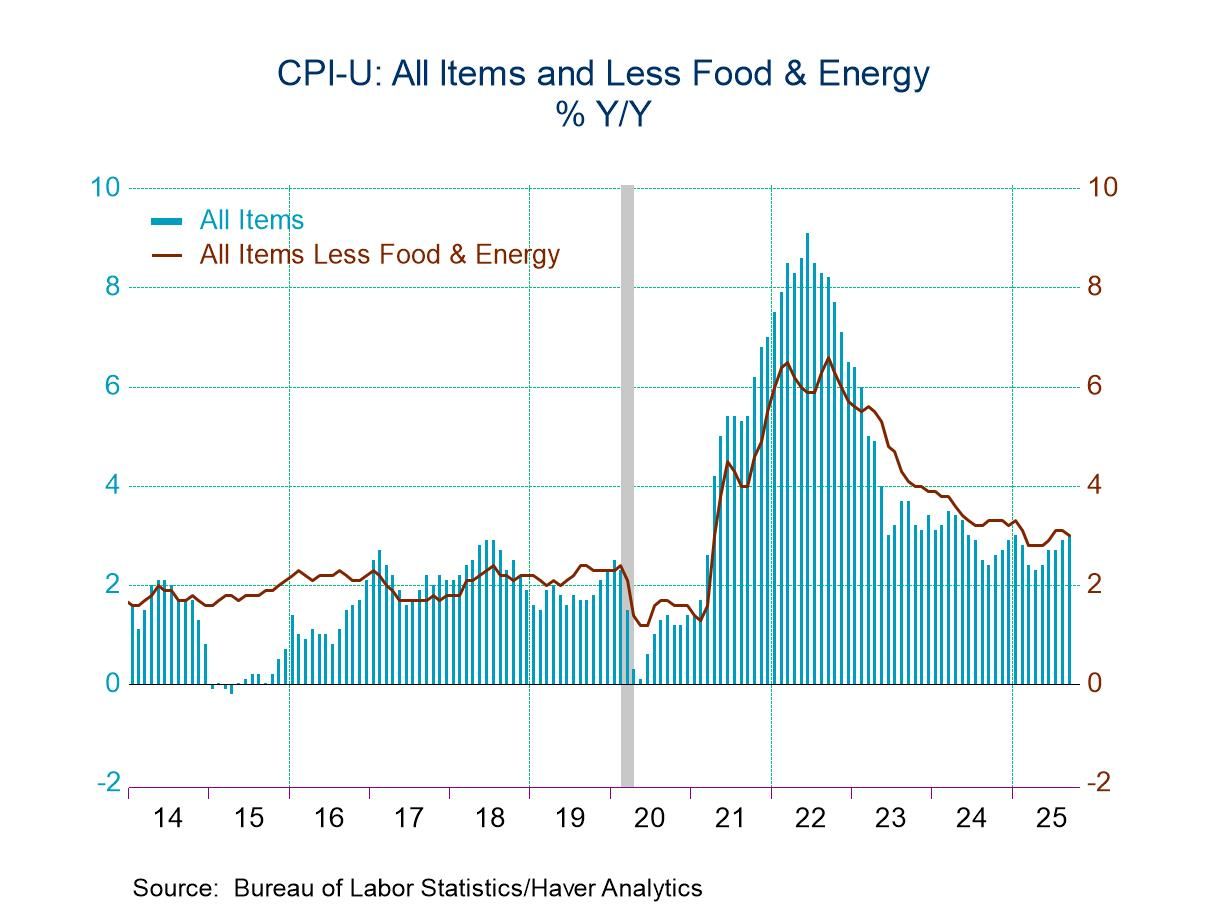
U.S. Consumer Price Inflation Moderates in September
- Monthly gains in total & core price indexes ease.
- Year-to-year comparisons edge higher.
- Core goods prices remain firm, but core services inflation eases.
by:Tom Moeller
|in:Economy in Brief
 Global| Oct 23 2025
Charts of the Week: Risks and Relief
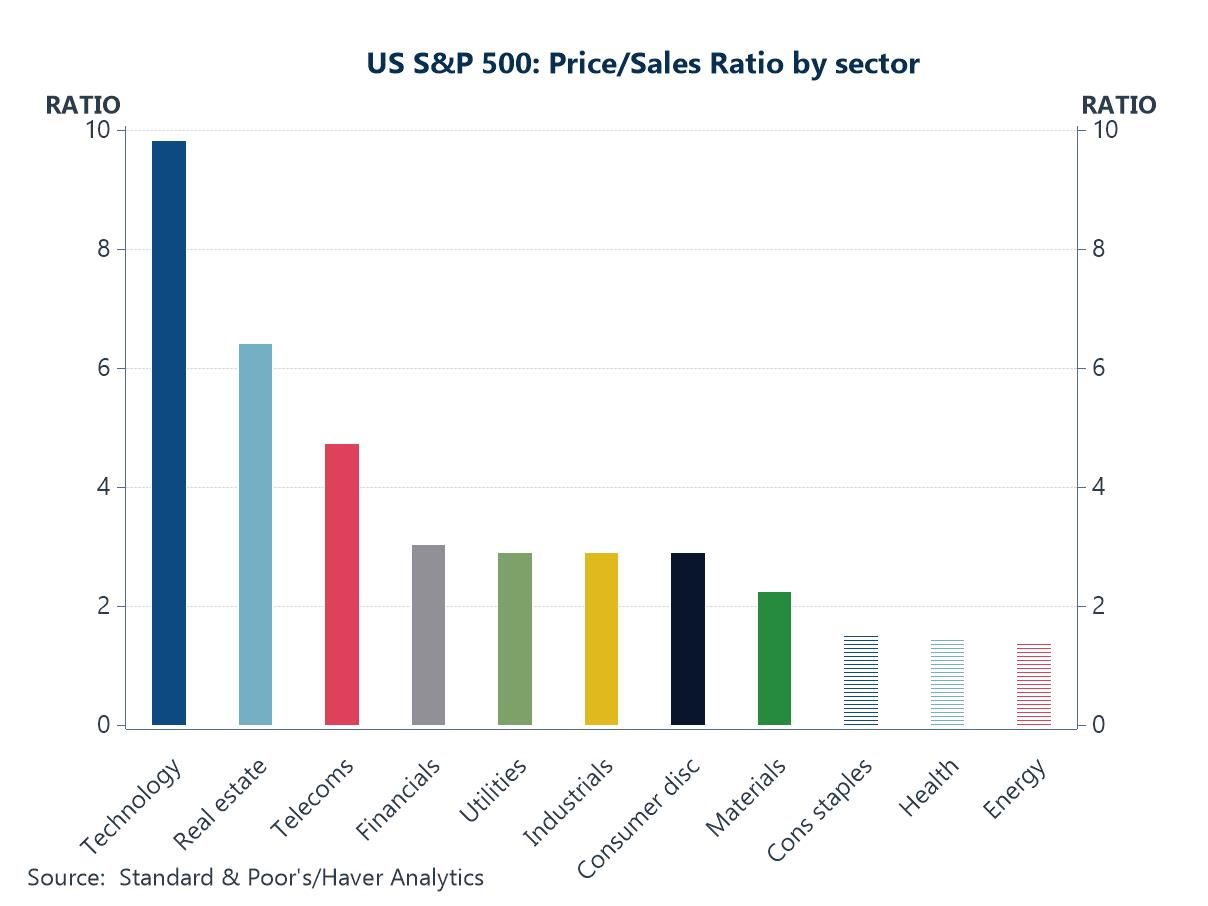
Financial markets have been caught between conflicting crosscurrents in recent days. On the one hand, risk sentiment has been weighed down by mounting concerns over US lenders and broader credit conditions, renewed tariff worries, the ongoing government shutdown, and growing unease about a potential AI-driven valuation bubble (chart 1). On the other, expectations have strengthened that major central banks will continue to ease policy in the face of softer growth and moderating inflation, fueling hopes of a soft landing (chart 2). Supporting that view, oil prices have declined off easing geopolitical tensions in the Middle East (chart 3), and China’s credit impulse—together with stronger-than-expected GDP—has provided a quiet but important lift to global growth momentum (chart 4), even if property market weakness persists. US wage growth also continues to cool according to some private sector surveys (chart 5), helping to ease inflation concerns, while in the UK, softer headline inflation has been welcomed, though sticky services CPI and rising producer prices have tempered the good news (chart 6). Taken together, the macro narrative is one of lingering risks offset by moderating inflation pressures and easing hopes—an uneasy equilibrium that has left financial markets more volatile but still resilient.
by:Andrew Cates
|in:Economy in Brief
 USA| Oct 23 2025
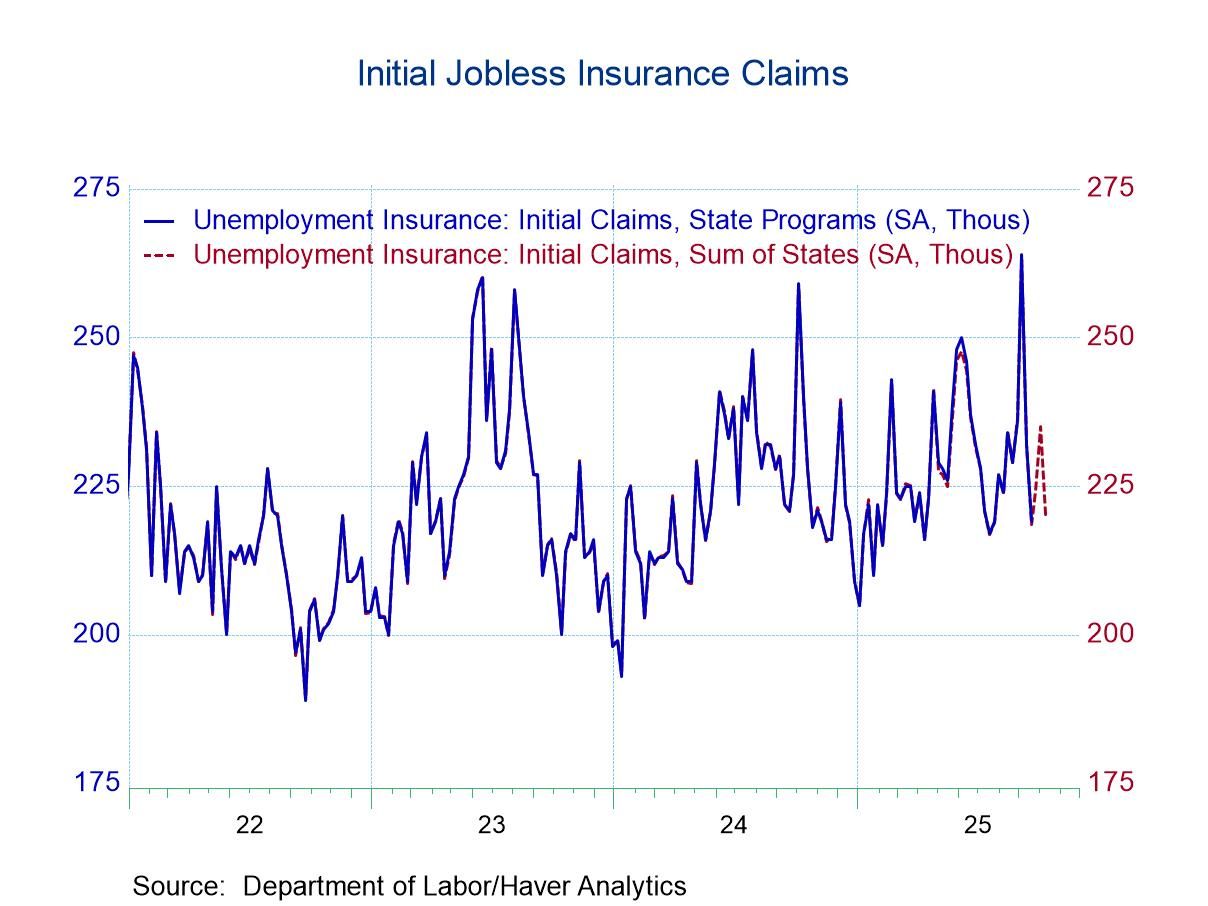
U.S. Unemployment Insurance Claims Ease in Latest Week
- Initial claims decline, reversing earlier increase.
- Continuing claims move lower.
- State unemployment rates vary.
by:Tom Moeller
|in:Economy in Brief
- of2724Go to 55 page