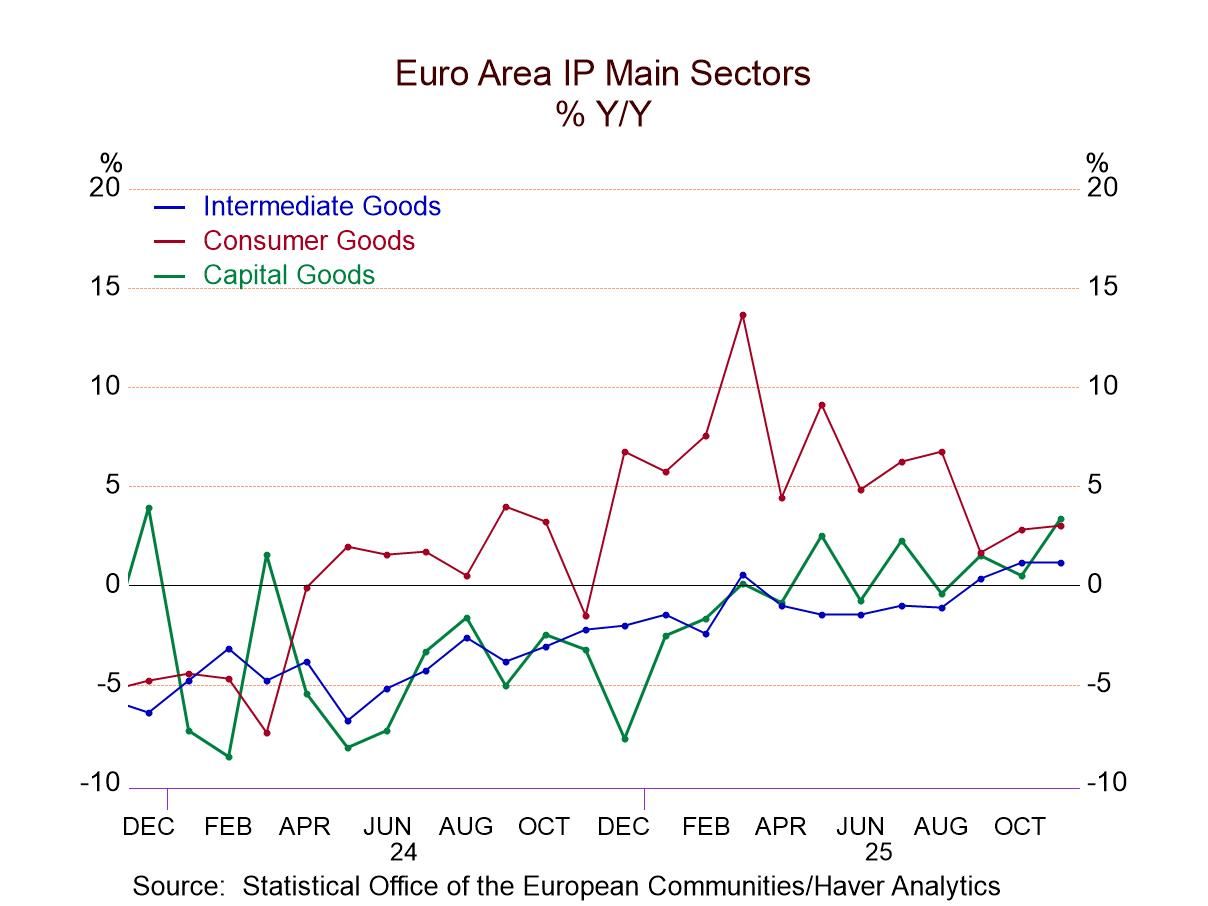
- Import prices advanced 0.1% m/m, the same monthly gain as in October and November.
- Both imported fuel and nonfuel prices rose in December.
- Export prices increased a larger-than-expected 0.3% in December. Gains were widespread across end-use categories.
- USA| Jan 16 2025
U.S. Import and Export Prices Rose in December
by:Sandy Batten
|in:Economy in Brief
- Total beneficiaries decline in prior week.
- Insured unemployment rate holds at 1.2%.
- Rates in states range from 0.33% in Kentucky to 2.95% in Rhode Island.
- USA| Jan 15 2025
U.S. Headline Consumer Price Inflation Edged Up in December
- The headline CPI increased 0.4% m/m. pushing the y/y rate up to 2.9%, the highest rate since July.
- The core index rose 0.2%, pushing the y/y rate down to 3.2% after four months at 3.3%.
- Energy prices were up markedly as the normal decline in gasoline prices was much less than the seasonal factors had anticipated.
- Services prices less energy remained elevated although the y/y rate slowed to 4.4%, the lowest since February 2022.
by:Sandy Batten
|in:Economy in Brief
- USA| Jan 15 2025
U.S. Mortgage Applications Surged in the January 10 Week
- Applications to purchase and to refinance loans jumped.
- Rates on 30-year fixed-rate loans rose moderately.
- Average loan size rose modestly in latest week.
- Europe| Jan 15 2025
EMU Industrial Output Sputters Ahead
Industrial output in the European Monetary Union continued to struggle. In November, it has advanced (for the headline series excluding construction) for the second month in row. However, a sharp drop in September leaves the three-month change in output falling at a 4.8% annual rate. Output still grows by 0.2% at an annual rate over six months but falls by 1.9% year-over-year. The output path is not draconianly weak, it is not even clearly weakening further, it is simply still challenged, fighting what appears to be still-stiff headwinds.
Manufacturing sector trends- Manufacturing output results are nearly the same as for the headline. Manufacturing sectors show progressive weakening from 12-months, to 6-months, to 3-months for consumer goods output. Both consumer durables and nondurable goods output show sporadic weakens but it is only when they are combined that consumer goods output as a total makes the progressive nature of weakening apparent. Intermediate goods output declines on all horizons from 12-months to 6-months to 3-months, but it is not clearly trending. Capital goods output drops over 12 months and falls even more sharply over three months but manages to make a gain over six months preventing a clear statement about the trend being made.
EMU PMI for MFG- The manufacturing PMI for the EMU is below 50 for each of the last two months and over three months, six months, and 12 months as well.
QTD: Quarter-to-date- Quarter to date IP tracking shows declines in all sectors except capital goods output. Tracking output developments since COVID arrived from January 2020-to-date, output is higher only for overall consumer goods and that is driven only by the component consumer nondurable goods output. However, capital goods output is nearly unchanged on that horizon; the current level of capital goods output is lower than its January 2020 level by only 0.5%.
Growth rankings- The ranking of year-on-year growth rates for November compared to all year-on-year growth rates since early-2007 shows no sector ranking higher than 38%. All rankings are below their median rates of growth over this period. The growth ranking for overall IP and for manufacturing are near their 25th percentiles marking them essentially lower quartile growth results.
Country data The country data for 13 EMU members show four declines in November month-to-month following five with month-to-month declines in October and seven in September. The breadth of weakness on this measure has been diminishing. The country of declining output over 12 months, six months, and three months has been progressively falling as well -another good sign. And the median annualized growth rate has been rising over this span. However, quarter-to-date as of November, there are still seven countries showing output declines in progress with one at unchanged. Output is rising QTD in only five of thirteen EMU nations. However, in terms of growth rankings, there is relatively stronger growth only for the smallest countries in the EMU.
Summing up Growth rankings are above the 50% median mark only for Finland, Greece, Belgium, and Malta. The big four economies Germany, France, Italy, and Spain, each have growth rankings below their respective historic medians with an average ranking of 26.5% - again near the lower quartile border. The EMU area is performing poorly with growth sputtering and weak growth still the order of business across sectors as well as across member nations.
- USA| Jan 14 2025
U.S. PPI and Core PPI Gains Ease in December
- Overall index rise softer than expected.
- Advance in core goods prices is steady.
- Advance in services price is steady.
- USA| Jan 14 2025
U.S. NFIB Small Business Optimism Rises Again in December; Highest Level Since October 2018
- December NFIB Small Business Optimism Index up 3.4 pts. to 105.1.
- Uncertainty Index down 12 pts. to a six-month-low 86.
- Expectations for economy up 16 pts. to 52%, the highest since March 2002.
- Expected real sales up 8 pts. to 22%, the highest since January 2020.
- Inflation (20%) remains top business problem, followed by Quality of Labor (19%); both unchanged from November.
- Japan| Jan 14 2025
Economy Watchers Index Improves But Shows Shrinkage in December
The plot of the economy watchers readings since mid-2024 paints a pretty clear picture of the performance of the economy according to this metric. The chart shows the summary. The future conditions index, the current conditions index, and the reading for current conditions employment, have all been below diffusion values of 50 on a fairly steady basis. In addition, there has been little tendency for trend to take hold; there appears to be some modest up trending going on from early-2024 to later in the year. However, more recently we see some backfilling in terms of that progress. All told it's hard to make too much out of these readings other than to note that diffusion values have been slightly below 50, indicating slight deterioration in current conditions, in the employment market, and for expected future conditions. The results are not draconian. It's really just been a period of slight underperformance by the economy and for expectations for the future and in terms of the job market.
December Current Index In December, among the nine component readings for the current index, four of them produced diffusion values above 50, indicating some net expansion. Corporate nonmanufacturers registered 50.5, the household sector generated a rating of 50.2, retailing came in at 50.4, while the services sector produced the highest reading at 51.1. All of these are readings very close to 50 and are not showing much in the way of growth. But being above 50, they are signaling some small net expansion. The contracting side of the ledger in December shows eating and drinking places with the diffusion value of 46.9, housing at 46.5, corporate manufacturers at 47.2, the overall corporate reading at 49.1, and the employment reading at 49.7. The current reading is an echo of the performance of the headlines plotted in the chart at the top, indicating a close clustering around the value of 50. There are a few sector readings with diffusion values slightly above 50 and a few with readings below 50. However, over 12 months we have net declines for all of the readings except for housing and for retailing.
Diffusion ratings pertain to month-to-month activity comparisons while the queue standings describe the December diffusion index ranked among its historic data on a longer timeline back to 2002. The ranking data put a slightly different spin on events because the current index, which is at 49.9, showing the barest decline in terms of the diffusion index, also has a queue standing at 69.6% which tells us that over this span the index has been stronger only about 30% of the time. A modest contraction is actually significantly stronger reading than Japan has been used to seeing over this 20-plus year period. Looking at the rankings across the components, we find only two have a percentile standing below their 50%-mark, employment at 29.2% along with corporate manufacturers at 47.8%.
December Future Index The future index has a diffusion reading of 48.8; that shows a weakening compared to November's reading at 49.4. In December only two components have readings above the 50th percentile, services at 52.8 and nonmanufacturing corporations at 50.1; the latter is as bare bones a reading above 50 as possible. The remaining readings are below 50 indicating net contractions. The lowest being housing at 44.5, with three readings in the 47-diffusion range for corporate manufacturers, for eating and drinking establishments, and for retailing. As we saw with the current index, the 12-month change in the future index also shows a drop in the headline of 1.6 points with drops logged across most components with an increase only in nonmanufacturing corporations and an unchanged reading for retailing.
Queue percentile standings are weaker for the future index than for the current index. Its standing is only at 51.4% for the headline with four components having readings below the 50% mark, but for the most part, significantly below the 50% mark corporate manufacturers have a percentile standing at 45.1%, eating and drinking places have a ranking at 41.5%, housing has a ranking at 40.7%, and on the outlook for employment there is a reading at 30%.
On balance, the economy watchers index does not indicate much change in Japan's economy in December. The outlook deteriorates slightly from November, but it's still roughly unchanged in its diffusion value showing only slight deterioration; that continues to be the overall picture just as for the current index where deterioration continues to be the picture despite some reduction in the pace of slowing this month. The queue standings, however, show that the current index is posting numbers that are relatively firmer compared to what they've been over the last 20 years or so. The future index is much more modestly positioned compared to its historic readings.
- of2591Go to 6 page