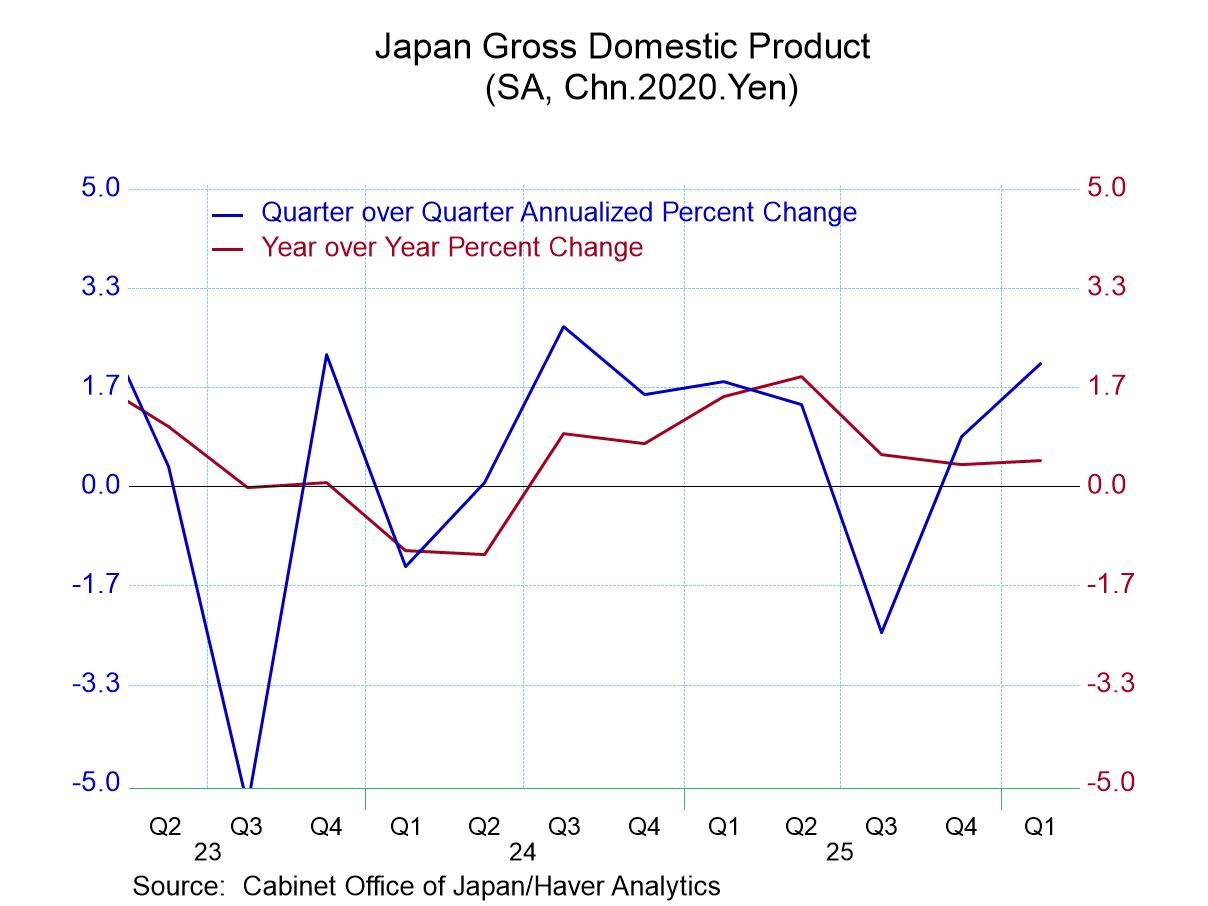
- Energy prices weaken and food prices firm.
- Price gains in core goods pick up.
- Services prices decline.
- USA| Mar 13 2025
U.S. PPI Is Unchanged in February; Rise in Core Index Moderates
by:Tom Moeller
|in:Economy in Brief
- USA| Mar 13 2025
Unemployment Insurance Claims Ease Slightly in March 8 Week
- Initial claims were less than forecast.
- Total recipients of unemployment insurance also fell.
- Insured unemployment rate still 1.2%.
- Europe| Mar 13 2025
EMU IP: A Long Dig-out Is Underway
Industrial output European monetary union rose 0.8% in January; this is for the headline series that excludes construction. Manufacturing output rose by 1% in January as well.
Sequential calculations show that overall manufacturing fell by 0.1% over 12 months, rose at a 0.8% annual rate over six months, and is now rising at a 2.1% annual rate over three months and accelerating pattern. Similarly, manufacturing output rises by 0.1% over 12 months, gains 0.2% at an annual rate over six months, and expands at a 2.1% annual rate over three months Like the headline series, manufacturing also shows acceleration in output is underway. The effect is present but not powerful.
Sectors In January, the gain in overall output was mostly on the back of intermediate goods where output rose 1.6%, capital goods output also rose by 0.5%, consumer goods output fell by 2.8%. In the month, however, the strength of intermediate goods and capital goods was enough to carry the day to an overall output expansion. Sequentially, looking at growth rates over 12 months, six months, and three months, we see a steady acceleration for overall consumer goods output, for the output of consumer durable goods, and generally for the output of consumer nondurables (with a very small exception). Intermediate goods output also shows steady acceleration. The only real exception is for capital goods, where output falls by 2.1% over 12 months, improves to a decline of only 1% over six months but then lapses into a 4.7% annual rate decline over three months. Manufacturing, except for capital goods output, is showing acceleration that is broad-based.
Quarter-to-date In the quarter to date, overall output is growing at a 3.6% annual rate. Manufacturing output is growing at a 3.3% annual rate. Output growth is positive in all the manufacturing sectors and subsectors except for capital goods where output is falling quarter-to-date at a substantial 4.1% annual rate. All of these, of course, are nascent figures because we are only one-month into the quarter. These growth rates are calculated by taking the compounded annual rate for January over the centered fourth quarter average for all of output, sector-by-sector.
More broadly, the queue percentile standings show that year-over-year output growth is below its median. The queue percentile standing data show broad-based weakness in the industrial sector. Overall output has a 32.6 percentile standing; manufacturing has a 26.6 percentile standing. Across sectors, consumer goods output is still strong with an 88.5 percentile standing- that's the result of strength in consumer nondurables that have a 90.4 percentile standing. However, consumer goods output is still held back by a consumer durable goods output standing, at a 38.1 percentile. Intermediate goods have a 32.1 percentile standing, while capital goods, which is an important sector in the European Monetary Union, have only a 15.6 percentile standing, extremely weak.
Across countries Reviewing the data across countries, Among the 11 reporting EMU countries, five of them show IP growth above its historic median rate since 2006. Austria, Germany, and the Netherlands show output on an accelerating path, while France, Spain, Malta, and Ireland show decelerations in train. Viewed separately rather than as part of a sequence, output is nonetheless accelerating in 50% of the reporters over 12 months, in 41.7% over six months and among 54.5% over three months. There is progress but it is uneven and still slow. However, with the new tilt to more military spending – something that is already agreed to in Germany - we can expect output progress will step up more readily in the months ahead.
- Both gauges are roughly half of January increases.
- Core goods & services price gains slow.
- Energy & food price increases weaken.
by:Tom Moeller
|in:Economy in Brief
- USA| Mar 12 2025
U.S. Government Budget Deficit Deepens in FY 2025
- Federal receipt growth improves.
- Outlay growth surges.
by:Tom Moeller
|in:Economy in Brief
- USA| Mar 12 2025
U.S. Mortgage Applications Rise 11.2% in the March 7 Week
- Purchase applications increase 7.0% w/w; refinancing loan applications gain 16.2% w/w.
- Effective interest rate on 30-year fixed-rate loans declines to a still-elevated 6.85%.
- Average loan size rises to a record high.
- Japan| Mar 12 2025
Japan’s Cabinet Office Survey Edges Lower in 2025-Q1
The Cabinet Office: General business conditions Japan's Cabinet Office survey of general business conditions shows a diffusion reading of +2 in the first quarter of 2025 compared to a net of +5.7 last quarter. This is the reading for all big companies. The reading for large manufacturers slipped to -2.4 from +6.3, a much sharper drop. Unfortunately, manufacturing is often looked upon as the harbinger for future developments in the economy. Non-manufacturers show their reading slip as well, to +4.1 from +5.4 in the first quarter of 2025 compared to the fourth quarter of last year.
Smaller company results- Medium-sized manufacturing companies, posted a decline in the fourth quarter and a bigger decline than this first quarter, logging a reading of -1.5 at the end of last year and the reading of -6.9 in the current quarter. Small manufacturing companies continue to post negative results, and they also saw substantial slippage, falling from a -12.4 reading in the fourth quarter to a -18.3 reading in the first quarter of 2025.
Rankings In the table, I include rank standings for these readings on data that are back to 2004, an approximate 20-year horizon. The overall reading for large companies has a 54.8 percentile standing, which is above its historic median for that timeline. However, large manufacturing companies have a standing only at their 38.1 percentile. Medium-sized manufacturers have a reading at their 34.9 percentile, not too different from large manufacturing enterprises. Small manufacturers, despite their much-weaker negative reading in the first quarter, show a queue percentile standing in their 44.6 percentile. They chronically pose weaker numbers than their larger counterparts; therefore, when ranked relative to their own history, their current weaker diffusion readings don't seem to be quite as weak on a ranking basis. However, none of this puts too much positive spin on the data for the quarter.
General domestic conditions The readings for general business conditions show even a higher percentage of readings that are below their 50th percentile which puts them below their median ranking. The reading for all large companies decreased to 3.1 in the first quarter of 2025 from 4.2 at the end of last year. Large manufacturers slipped from +2 at the end of the year to -1.3 in the current quarter; medium-sized manufacturers slipped to -8.7 in the current quarter from -3.8 in the fourth quarter of last year while small manufacturers slipped to -22.8 from -20.9. The standings show the reading for all big companies at a 45.8 percentile standing; the standing for large manufacturers at 33.7 percentile; the standing for medium-sized manufacturers had a 34.1 percentile standing and for small manufacturers there is a 43.9 percentile standing.
Number of employees The readings for the number of employees conversely improved for large companies, moving to 28.3 in the first quarter of 2025 from 27.4 at the end of the year; for large manufacturers there is an improvement as well to 20 in 2025-Q1 from 19 in the fourth quarter. Medium-sized manufacturers see slight slippage to 32.7 from 33.3 at the end of the year, and small manufacturers see a slippage as well to 21.7 from 24.4 at the end of the year. Large companies and large manufacturers are improving while the smaller firms are falling behind. However, there's a proliferation of rankings for these results in the 90th percentile in fact, in the high 90th percentiles. For all big companies, there's a 98-percentile standing, the same as for large manufacturers. Medium-sized manufacturing companies have an 89.3 percentile standing and small manufacturers have a 79.8 percentile standing. None of these are weak or disappointing readings.
Quarters ahead... Beyond the current quarter, there are also readings in the table for the next quarter and the second quarter ahead. I provide only rankings for these readings and what we see is that for the quarter ahead conditions for large firms and large manufacturers are generally weakening and weakening significantly comparing the queue percentile standings in the current quarter to the standings for the next quarter ahead. However, for the second quarter ahead, there's generally a bounce back from the weakness in the quarter ahead, but that bounce back still does not take the ranking readings back to the levels achieved in the first quarter. For the most part, this is not particularly impressive result. The cabinet report retains a downcast view of the futures as well as a weak – and weakening- assessment of current economic performance. This deteriorated view is not as widespread as it might have been since it seems to have bypassed at least a piece of the job market where readings remain firm to strong in historic comparison.
- USA| Mar 11 2025
U.S. JOLTS: Openings & Hiring Improve in January
- Job openings rise during January following a lessened December decline.
- Increase is concentrated in retail trade & financial industries.
- Hiring improves but separations increase.
by:Tom Moeller
|in:Economy in Brief
- of2609Go to 7 page