- Initial claims come in much lower than forecast.
- Continuing claims rise modestly.
- Insured unemployment rate is unchanged.

by:Tom Moeller
|in:Economy in Brief
 Germany| Apr 17 2025
German PPI Dives But Core Rate Advances
Germany’s PPI in March fell by 0.7%; this is for the headline series excluding construction. The quasi-core PPI, excluding energy, rose by 0.2% in March. The headline series shows a number of months with the inflation rate negative, that is, with the price level falling, while the PPI excluding energy its flat in January with a 0.2% increase in February and in March. The stellar performance of the headline owes to weakness in oil prices.
Progressive inflation calculations on the PPI headline shows a decline of 0.2% over 12 months, a decline at a 0.9% annual rate over six months and a decline at a 4.9% annual rate over three months. These are progressively improving inflation dynamics; in fact, inflation that might be alarmingly weak under other circumstances. However, the PPI excluding energy is up by 1.5% over 12 months, up at a 1.2% annual rate over six months and up at a 1.4% annual rate over three months. These are clearly moderate increases in inflation and the quasi-core rate for the PPI has clearly stabilized.
In the first quarter, the German PPI inflation rate is falling at a 2.1% annual rate as the PPI excluding energy is rising at a 1.1% annual rate.
PPI components are not seasonally adjusted and are a little bit less interesting because of that. But the patterns for consumer goods, investment goods, and intermediate goods in the PPI show that all of them have stronger three-month annualized growth rates than 12-month growth rates, the opposite signal that we get from the headline which is seasonally adjusted.
Of course, monetary policy focuses much more on CPI prices than PPI prices; on that basis, the German CPI is up 2.2% year-over-year compared to a CPI ex-energy that's up at a 2.7% annual rate. Inflation presented on a CPI basis is much hotter than it is on a PPI basis and that's not surprising because the PPI is focused on the goods sector and production in Germany while the services sector has a much higher inflation rate and an inflation rate that tends to be more stubborn to change.
The table also chronicles the impact of Brent oil where prices fell by 3.5% in March after falling 3.8% in February. Over three months Brent is falling at a 4.6% annual rate which is a stronger decline than a 1.3% annual rate drop over six months, but year-over-year the Brent price is still down by 14.6%, and that larger, longer-lasting decline is probably still working its way through the pipeline into German prices.
 USA| Apr 16 2025
U.S. Retail Sales Surge in March
- Nonauto sales rise moderately.
- Motor vehicle & building materials drive sales overall.
- Gasoline sales decline despite higher prices.
by:Tom Moeller
|in:Economy in Brief

- March IP -0.3% (+1.3% y/y), led by a 5.8% m/m drop in utilities output.
- Mfg. IP +0.3%, reflecting m/m rises of 1.8% in aerospace & misc. transp. equipt. and 1.2% in auto production (w/ durable goods up 0.6% and nondurable goods unchanged).
- Mining activity rises 0.6%, the third m/m gain in four months.
- Key categories in market groups post mixed results.
- Capacity utilization down 0.4%pt. to 77.8%; mfg. capacity utilization up 0.2%pt. to 77.3%, the highest since May ’24.
 USA| Apr 16 2025
U.S. Home Builder Index Improves in April
- Small increase follows two months of decline.
- Regional performance varies.
by:Tom Moeller
|in:Economy in Brief

- Inventories rose 0.2% m/m in February on top of a 0.3% m/m gain in January.
- February increase was led by wholesalers.
- Sales rebounded, rising 1.2% m/m, their largest monthly gain since July.
- With the rise in sales outpacing inventories, the inventory/sales ratio fell 0.7% m/m.
by:Sandy Batten
|in:Economy in Brief
 USA| Apr 16 2025
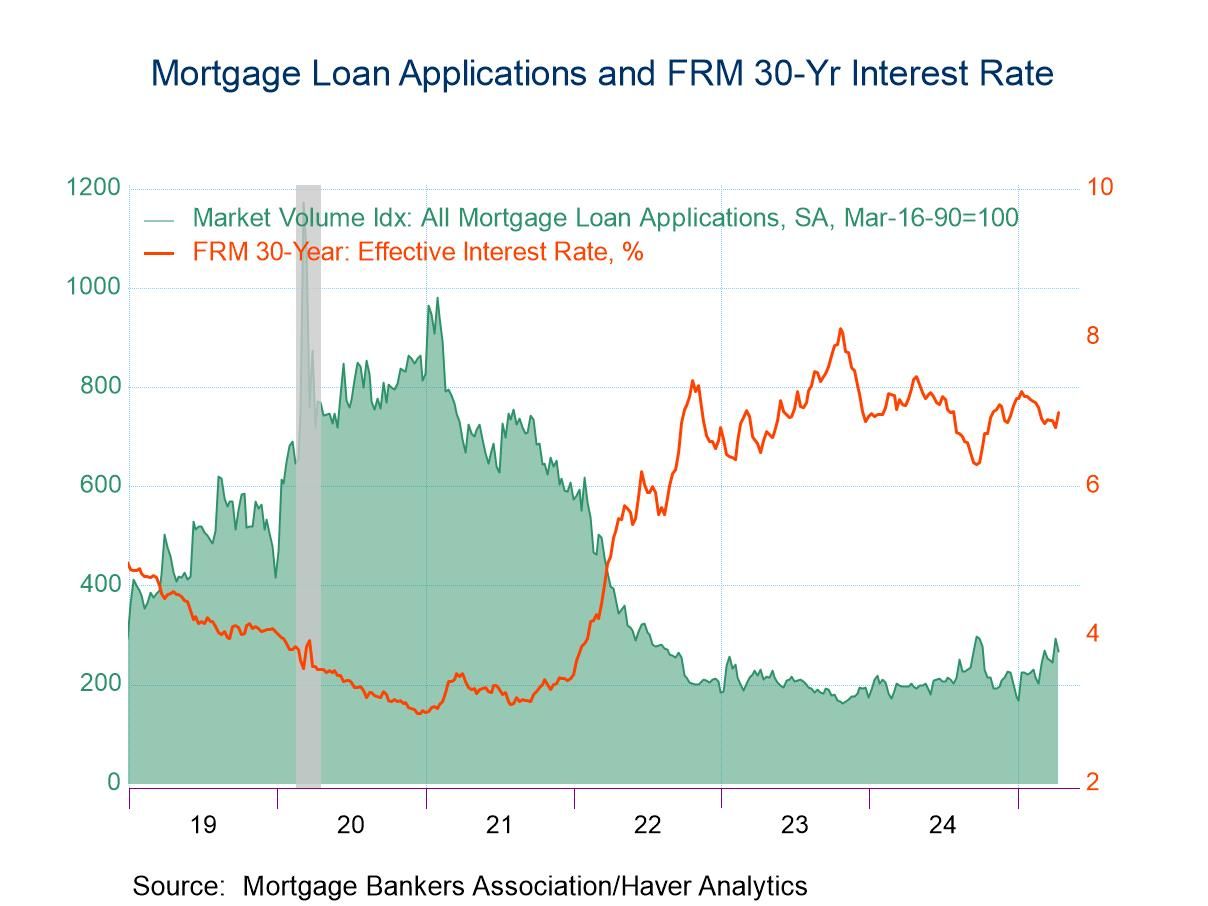
Mortgage Applications Drop as Rates Surge in Latest Week
- Purchase loan applications decline and refinanced loans tumble.
- Effective rates on loans post double-digit rises.
- Average loan size drops.
 United Kingdom| Apr 16 2025
U.K. Industrial Production Steps Up in February
Industrial output in the United Kingdom jumped in February, rising 2.2% compared to January. In January output fell by 0.9% while in December output increased by 0.7%. The February gain is large enough to turn some of the trends higher by itself: the 3-month trend is sharply higher after a gain like this, but the 6-month and year-over-year gains are only moderately higher, but again, they are pointing higher instead of lower.
Sequential and sector growth rates Sequential growth rates for industrial output show progressive improvement from a 0.3% annual rate over 12 months to 1.2% annual rate over six months to an outsized 8.2% annual rate over three months.
Sector gains for manufacturing show increases across the board in February with consumer durable goods output rising 8.6% month-to-month. Capital goods output rose 3.8% month-to-month. These gains were a reversal of widespread and generally smaller declines in January whereas in December there was an output decline for consumer durable goods but increases in all the other categories. As a result of these gyrations and past trends, consumer durables output is sequentially accelerating from an 8.5% growth rate over 12 months toward a 20.2% annual rate over three months; consumer nondurables also sequentially accelerate from 2.1% over 12 months to a 10.5% annual rate over three months. Intermediate goods are an exception; the year-over-year decline in output yields to an even a deeper pace of decline over six months but then a moderate revival emerges with a net gain over three months. Capital goods output has a strong accelerating trend with a gain of 0.5% over 12 months, an annual rate gain of 3.3% over six months and an annualized rate of 12.9% over three months. The trends and the breadth of output increases in the industrial sector for the United Kingdom is impressive but can it last?
Industry detail for several key industries: food distribution, textiles & leather, motor vehicles & trailers, mining & quarrying, and utilities show more irregularity. Output of textiles & leather is progressively and strongly accelerating. Motor vehicles & trailers dig themselves out of a hole with output falling 10.1% over 12 months, but it’s really improving to grow with a 3.5% annual rate over three months. Mining & quarrying shows declines in output over all horizons, but that's still an accelerating trend as the rate of decline slows over each sequential period. Food & tobacco show no clear trend although its 3-month growth rate is higher than its 12-month growth rate. Utilities output also shows strong acceleration, starting with a 1.2% gain over 12 months, rising at a 4.5% annual rate over six months and progressing to a 14.7% annual rate over three months.
With two months of data from the unfolding quarter in hand, manufacturing output is growing at a 3.2% annual rate in the U.K., led by consumer durables with output rising at 11.6% annual rate with intermediate goods as the weak category still falling at a 1.3% annual rate in the quarter to date. Among the five listed industries, all of them but one have output increases. In the unfolding quarter, the largest gains are in textile & leather and the only decline is in manufacturing and coring and that's only at a 0.4% annual rate.
This has generally been a weak period. For growth going back to January 2020 just before COVID started, also including the period of COVID, the invasion of Ukraine by Russia, and special issues for the U.K. because of Brexit, overall industrial production has actually declined by 5% over this span. All of the sectors show increases, however, except for intermediate goods which is the sector that drags down overall output because intermediate goods output falls 23.8% over the span.
The five individual industries listed all show declines over the period except for motor vehicles & trailers that show output is up by 16.1%; but output is down very hard for mining & quarrying nearly 42% lower than it was in January 2020, and utilities output is lower by nearly 26% over that same span.
- of2693Go to 79 page