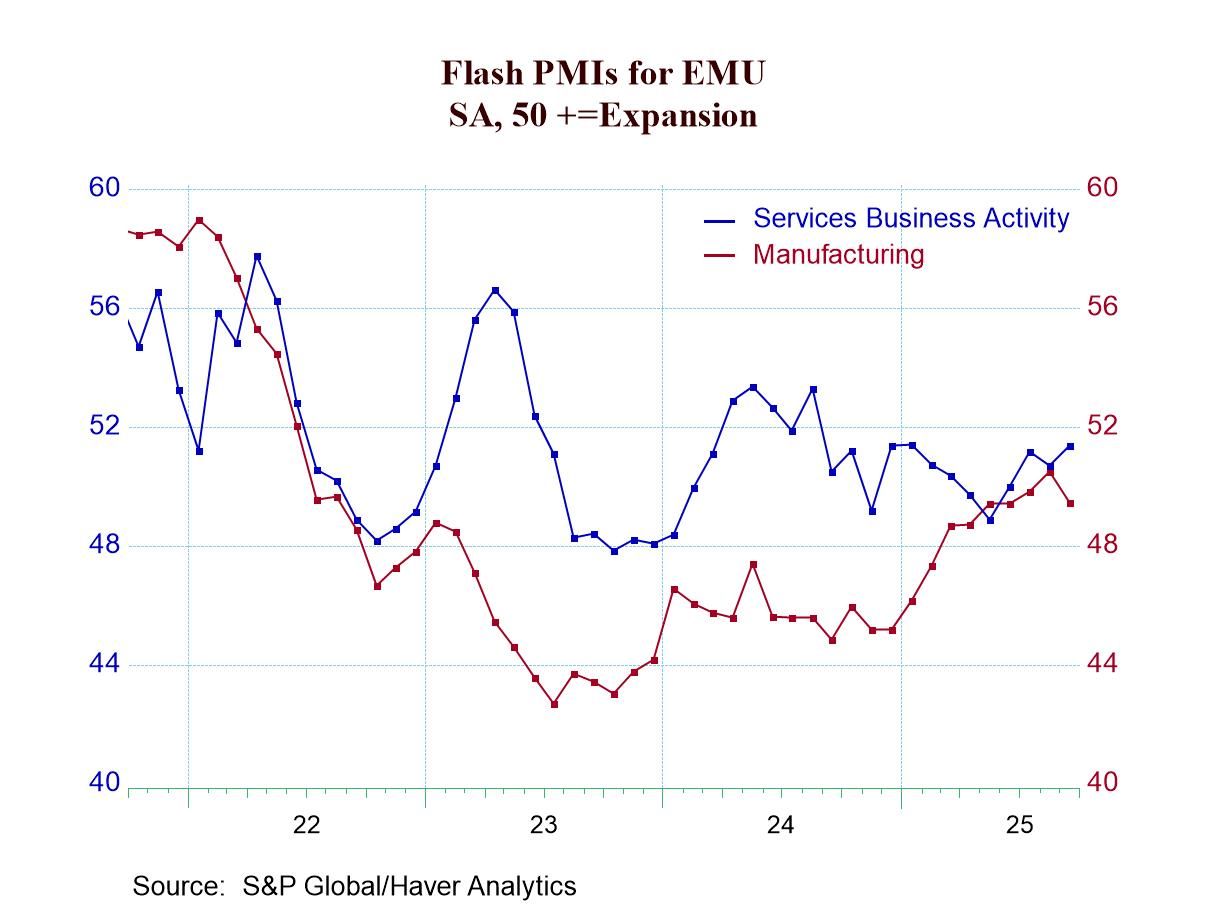
The S&P PMIs for September show more backtracking than they show progress, although over three months even in terms of up-to-date monthly data, the trends show uptrends (among 21 calculations of 3-month changes only three show setbacks). Weakening is shown in the service sector in the United States, India, and Australia while in the United Kingdom, France, Germany, and in the European Monetary Union (EMU) services sectors were getting stronger. In September, manufacturing weakened in the EMU, Germany, France, the United Kingdom, Australia, and India with only the U.S. showing improvement. Japan, a country that usually contributes to the early PMI flash survey, is not included this month in the early S&P release.
Sequential trends Over three months, we see broad strengthening across these reporting countries with Australia showing weakness across all three measures. India shows a composite weakening and a manufacturing weakening and France demonstrates manufacturing weakness. All the other 3-month metrics show strengthening. Using only the hard data and ignoring the up-to-date flash data that remained preliminary, there is still relatively broad strengthening over three months and six months. Over six months, the composite PMIs are strengthening everywhere except in Australia and in the United States with manufacturing improving broadly everywhere except in Australia, India, and in the U.K. Over 12 months, strengthening is also extremely broad with the United Kingdom an exception showing weakening on all three metrics- and with all the other metrics showing strengthening, except for services in Germany (17 out of 21 improve over 12 months).
Standings The queue percentile standing data show a proliferation of readings above the 50-percentile mark placing them above their medians on data back to January 2021; the exceptions are the U.K. with sub-median weakening in all three sectors and in the United States with a sub-par services readings but one that is barely below its median (at 49.1%!). France checks in with sub-median services and composite readings.
The outlook The chart at the top of this report makes a clear positive statement about the ongoing trend improvement. With the Federal Reserve in the U.S. having turned back to an easing cycle for interest rates even with inflation excessive, central banks may be ready to take a risk with stimulus. While inflation remains over target and may even be slightly accelerating, the pace of acceleration is very slight in the U.S. and largely the same conditions prevail globally. The current inflation overshoot faced by most central banks is modest; although in the case of the U.S., it has missed its inflation target for 4 1/2 years in a row-that should be worrisome but the Fed has pressed ahead with a rate cut and seems to favor even more.
The average results for the PMI readings sequentially for 12-months, 6-months and 3-months show steady improvement. The sequential readings are based on only hard data available through August. The more recent monthly data (far right hand column on changes) show June to September improvement for the composite index and for services averages with manufacturing slightly weaker.
The report on the month is slightly weaker, but the trending results are still encouraging. And if there is a new global easing cycle in train, growth will improve further even with the challenge of war remaining in place between Russia and Ukraine.


 Global