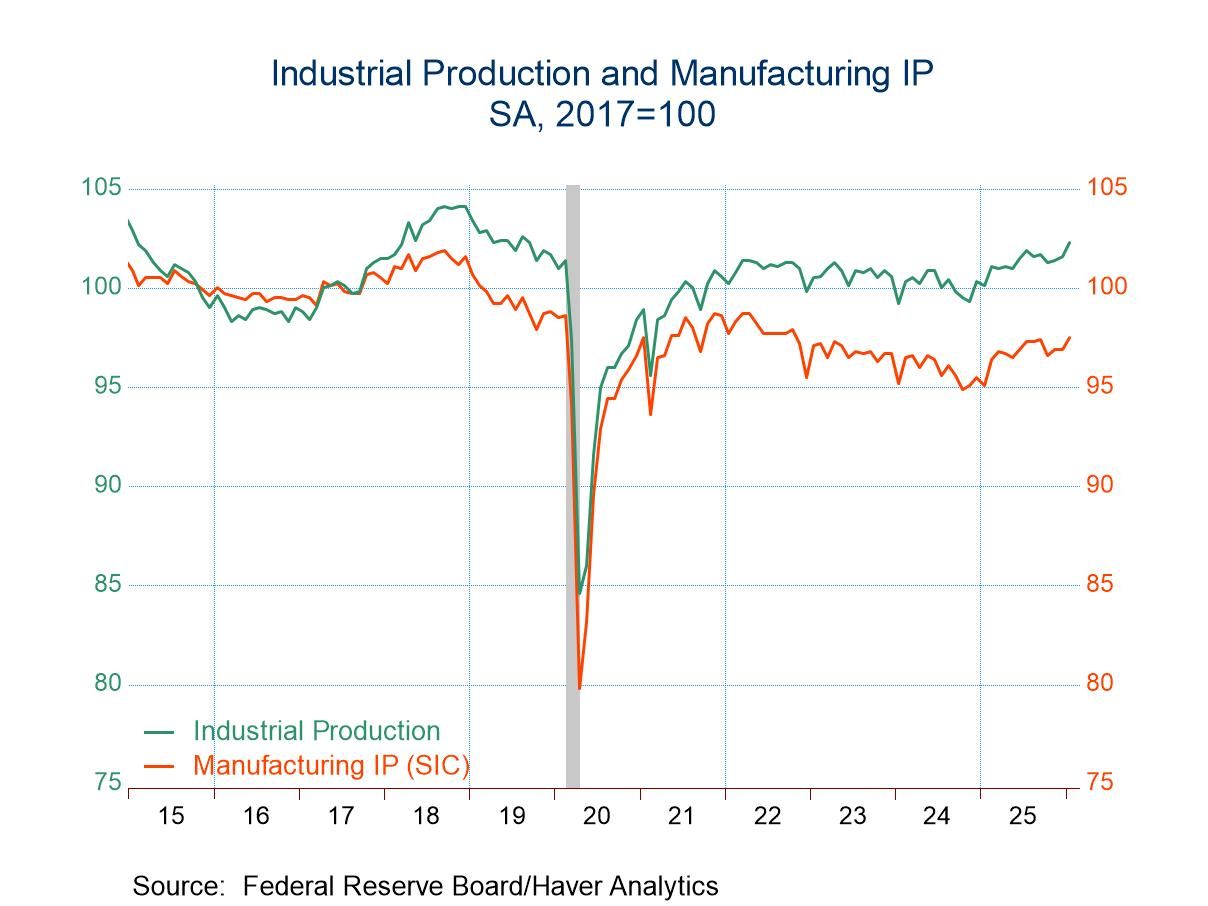
- Total industrial output increased a larger-than-expected 0.7% m/m in January.
- However, there were meaningful downward revisions to the previous two months.
- Manufacturing output increased 0.6% m/m, mining declined 0.2% m/m, and utilities production jumped 2.1% m/m.
- Rates of capacity utilization edged up in January but remained well below their long-term averages.
 USA| Feb 18 2026
U.S. Industrial Production Jumped in January
by:Sandy Batten
|in:Economy in Brief
 USA| Feb 18 2026
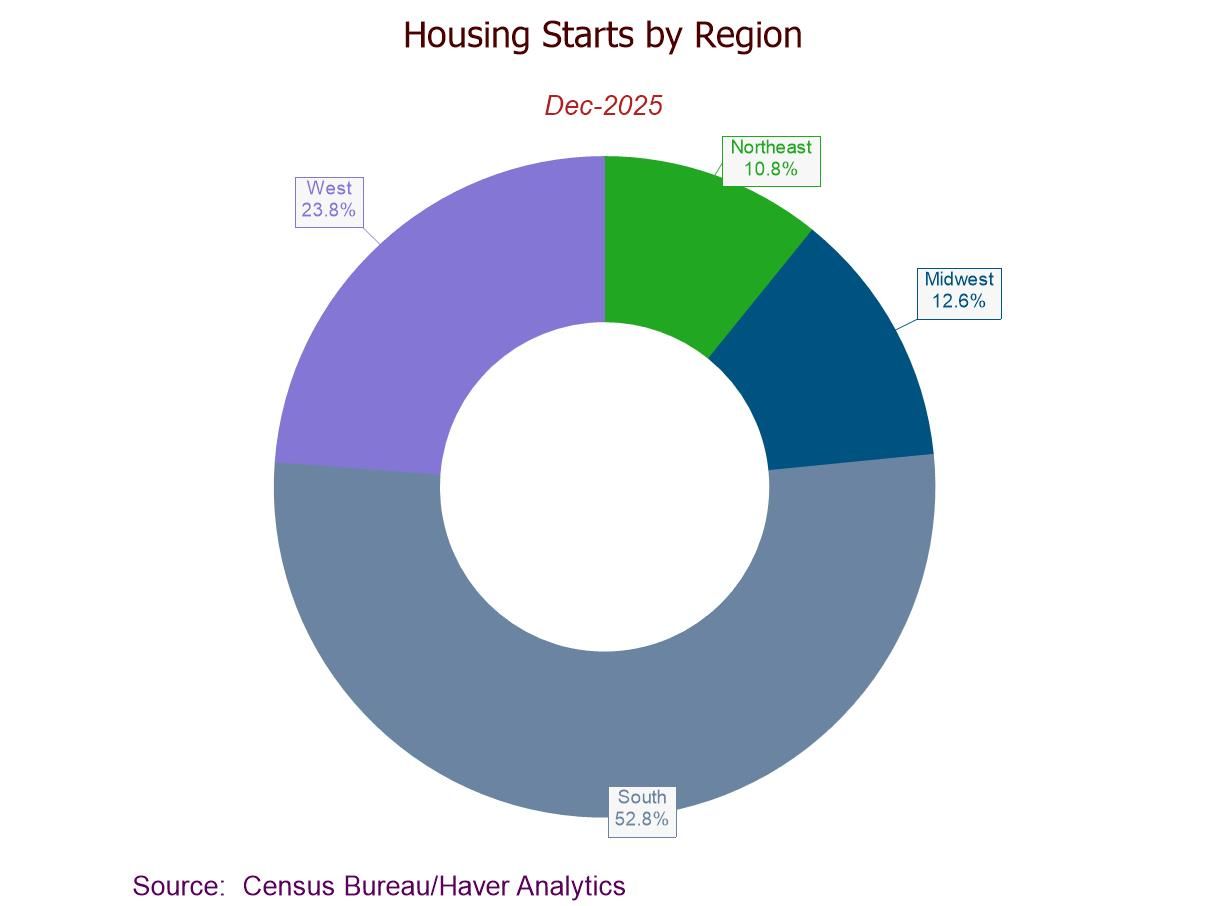
U.S. Housing Starts Advance in December to a Five-Month High
- Housing starts +6.2% (-7.3% y/y) to 1.404 mil. in Dec.; third m/m gain in four months.
- Single-family starts up to a 10-month high; multi-family starts up to a three-month high.
- Housing starts m/m up in the West, Northeast, and Midwest, but down in the South.
- Building permits recover to a nine-month high, led by a rebound in multi-family permits.
 USA| Feb 18 2026
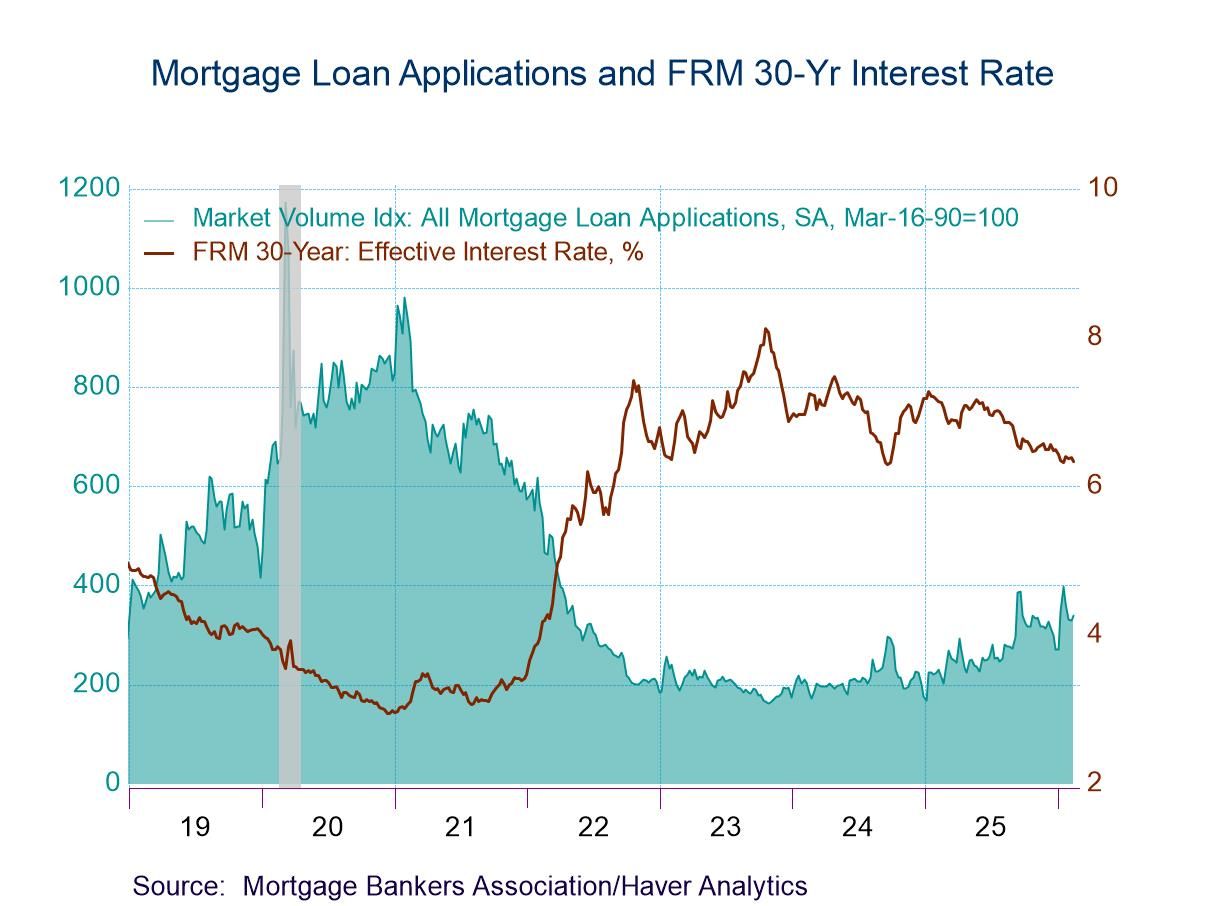
U.S. Mortgage Applications Rose in the February 13 Week
- Applications for loans to purchase declined in the latest week while refinancing loan applications rose.
- Effective interest rate on 30-year fixed loans declined 5bp to 6.33%.
- Average loan size rose.
 United Kingdom| Feb 18 2026
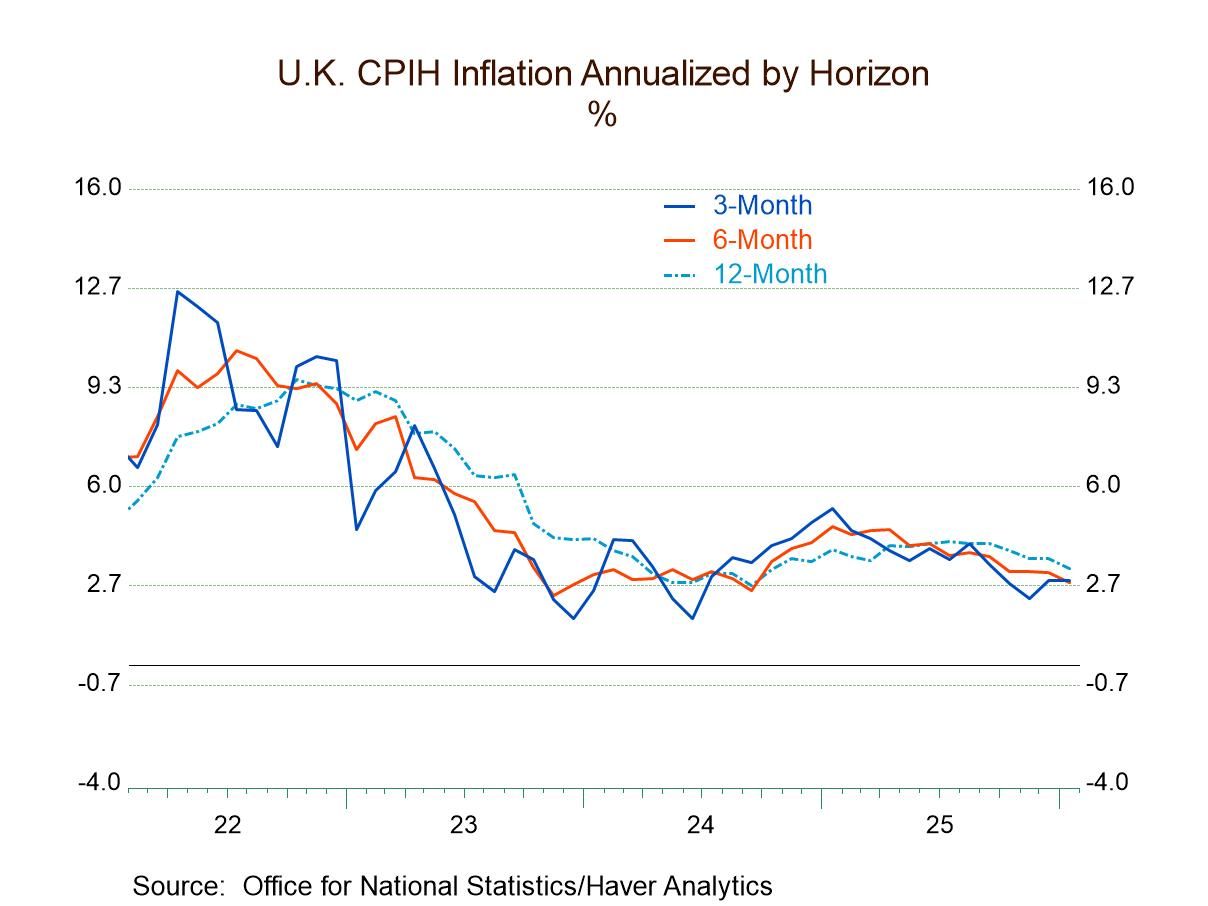
U.K. Inflation Waffles and Percolates
Inflation in the United Kingdom has irregularly downshifted over the past two months. In January, consumer price inflation remained steady at 2.8% over three months, the same pace as over six months. Core inflation ticked up to 3.3% over three months from 3.1% over six months but settled below the 12-month pace of 3.4%. Yet another measure, the HICP, comparable to the inflation rates reported by ECB numbers, logs 2.5% over three months, a slight uptick from six-month pace but less than the 12-month pace of 3%.
Diffusion The diffusion statistics that measure the breadth of acceleration of inflation across categories month-to-month came in at only 16.7% in January, down from 66.7% in December and compared to 33.3% in November. Diffusion readings below 50% indicate more deceleration than acceleration. So, inflation has been under control, with recent results showing more deceleration for inflation monthly than to accelerate. December was an exception. Over the 3 , 6 , and 12 month periods, inflation shows some acceleration tendency over 3 months, with diffusion at 58.3%; but that compares to 6-month diffusion at 16.7% and 12-month diffusion at 25%. Once again, the broad stroke for inflation, trending from 12 months to 6 months to 3 months, is showing more categories decelerating than accelerating.
Inflation rate ranking The final right-hand column ranks inflation rates on data back to 2000 based on their year-over-year performance. The current HICP, at 3%, has a 73.8 percentile standing among inflation rates back to 2000, marking it near the upper 25 percentile of the collection of results. The CPIH has a 79.6 percentile standing, putting it closer to the top 20% of observations over that same span. Core inflation at 3.4% has an 83.7 percentile standing, putting it in nearly the top 15% of results on data back to 2000.
Convergence around 2.8% The chart, supplemented by diffusion data, clearly shows that there is some inflation deceleration in progress; however, the level of year-over-year inflation still shows inflation among the upper ranges of what it's been over the last 25 years.
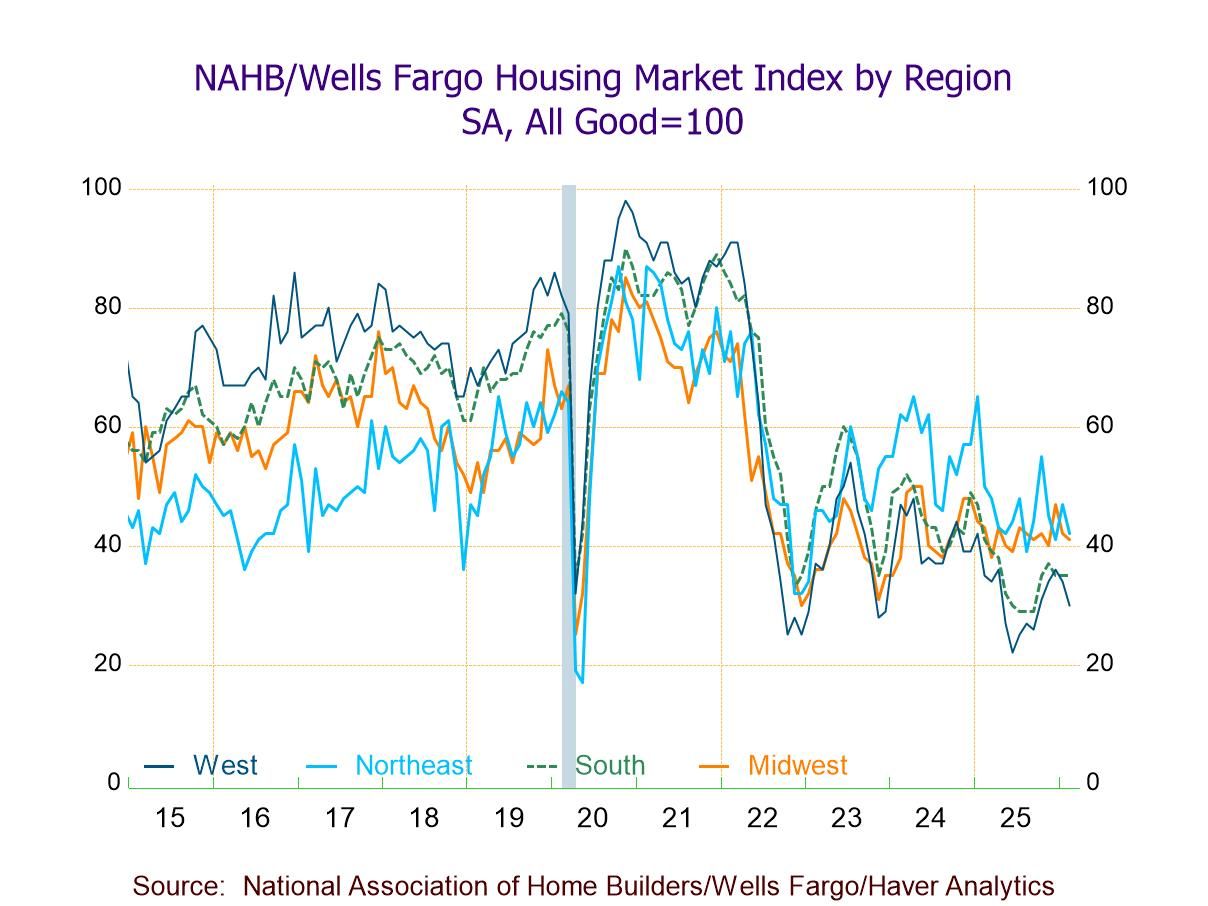
- HMI continues to weaken in Feb., indicating most builders remain pessimistic about the current and near-term housing outlook.
- Two of three HMI components fall, w/ the steepest m/m decline in potential buyers' traffic (-8.3%).
- Regional weakness continues, w/ the sharpest m/m drop in the West (-11.8%).
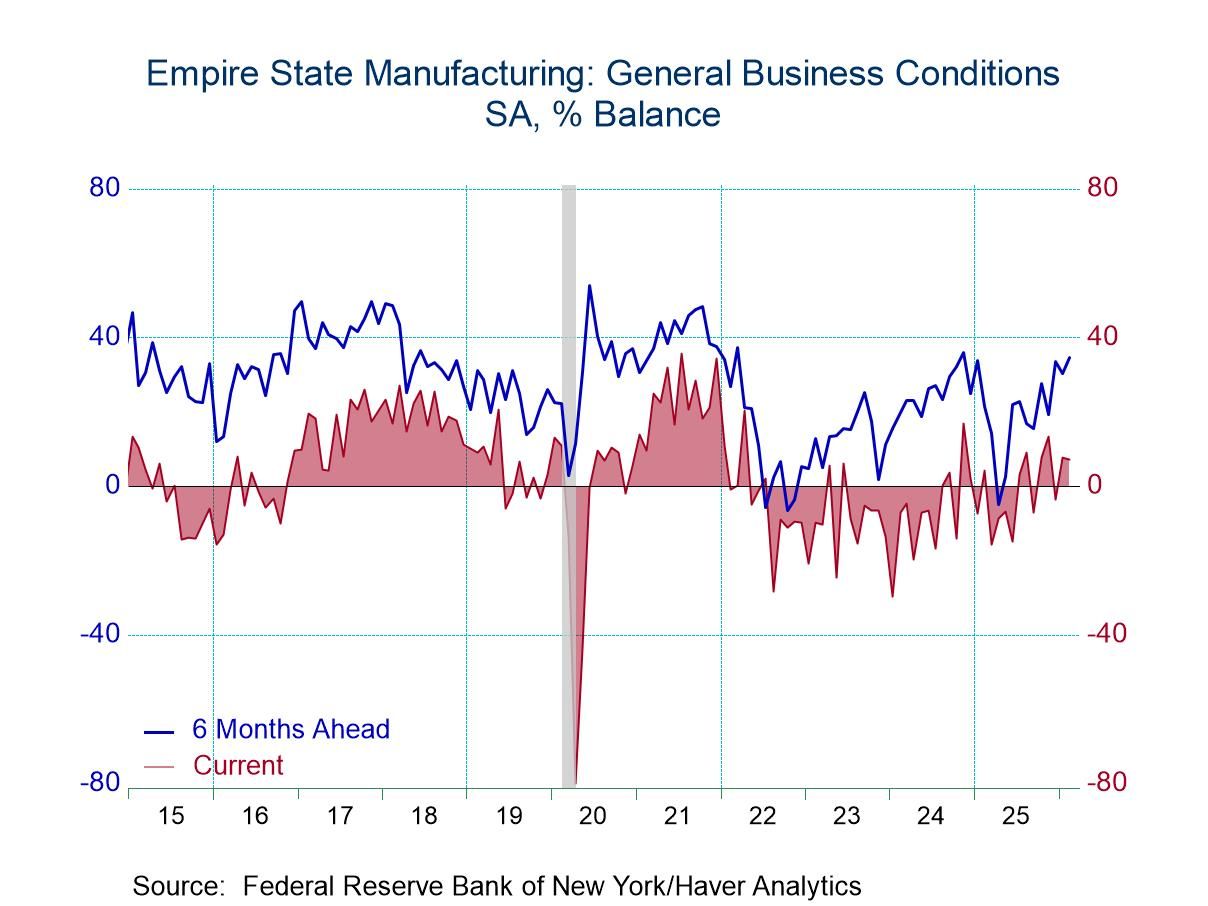
- The headline index edged down to 7.1 from 7.7 in January but continued to point to expansion.
- New orders slowed slightly while shipments plunged 17 points into negative territory.
- Prices paid and received both rebounded in February.
- Expected capital expenditures rose to a three-year high.
by:Sandy Batten
|in:Economy in Brief
Industrial output in the European monetary union fell by 1.4% in December. Manufacturing output fell by 1.3%. Output of consumer goods fell by 0.3%, output of intermediate goods fell by 0.1%, and output of capital goods fell by 1.9% in December. The subsector, consumer durables, showed an increase in output of 0.2% in December. Headline and manufacturing output in December reversed the increases seen in October and November. However, consumer goods, consumer nondurables, and intermediate goods saw two consecutive months of output declines for November and December.
Turning to sequential trends, overall industrial output rises by 1.1% over 12 months, falls at a 0.8% annual rate over six months, and then falls at a 1.2% annual rate over three months showing a tendency for deceleration. Manufacturing shows the same pattern of eroding growth rates for the one-year and shorter horizons.
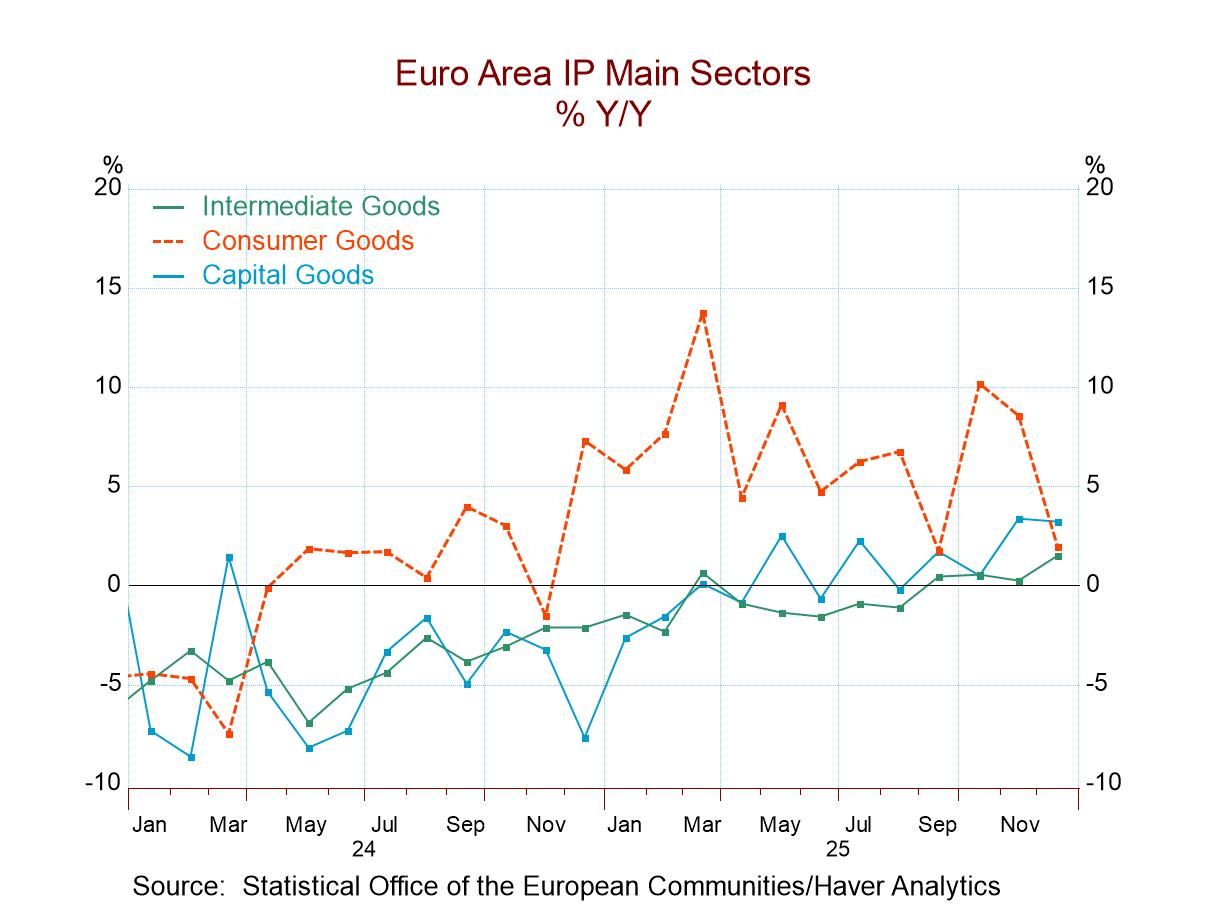
Sector stories However, for consumer goods, manufacturing output is accelerating steadily from a growth rate of 2% over 12 months, to a 7% pace over six months, and to a 16.6% annual rate over three months; the inclusion of ‘semi-durables’ in this category total makes it stronger than the two detailed subcategories of durable and nondurable goods. Consumer durables output transitions from falling 2.3% over 12 months to growing at a 3% pace over three months. Consumer nondurables output shows persistent declines, with slightly more intense over shorter periods, echoing the deceleration phenomenon. Intermediate goods and capital goods do not show clear sequential trends, but both categories show increases in output over all three horizons.
Cross currents These cross currents among sectors make it hard to characterize what's happening with output trends in the European Monetary Union. The country detail shows a good deal of turbulence, with a number of countries showing decelerating output trends and others showing accelerating output trends. It's fair to say that manufacturing in the EMU continues in the grip of cross currents. While the short-term data in the table that look at growth rates from 12-months to 6-months to 3-months show more weakening than strengthening, the trends in the graph across recent 12-month growth rates seem to show a little more solidifying and expanding behavior – albeit with confusing volatility as well.
Quarter-to-date (concluded Q4) In the quarter to date, all of the sectors and subsectors show output rising except for the aggregate for manufacturing that is flat, and consumer nondurables that show a decline at 6.7% at an annual rate. In the quarter to date, overall output is growing at a 1.4% annual rate, while consumer goods output is expanding at a 13.8% annual rate, immediate goods output is expanding at 1.5% annual rate, and capital goods output is expanding at a 3.7% annual rate. Those sector numbers look exceptionally healthy.
Ranking the trends The far-right hand column analyzes the 12-month growth rates comparing them to historic growth rates since 2006. Most of the growth rate rankings over this span are moderate, with standings above their respective 50th percentiles, placing them above their historic medians. However, consumer durable goods and nondurable goods are exceptions, with rankings in their 31st percentile and 10th percentile, respectively. Consumer nondurables output is particularly weak in comparison with historical trends. On the other hand, intermediate goods and capital goods output have rankings in their 60th percentile, and for all consumer goods output, the ranking is near its 60th percentile. Looking only at manufacturing, the ranking slips to its 52.9 percentile; for the headline series which excludes construction, the ranking is at its 53.8 percentile.
 USA| Feb 13 2026
Consumer Price Index: Slow, but Steady, Deceleration
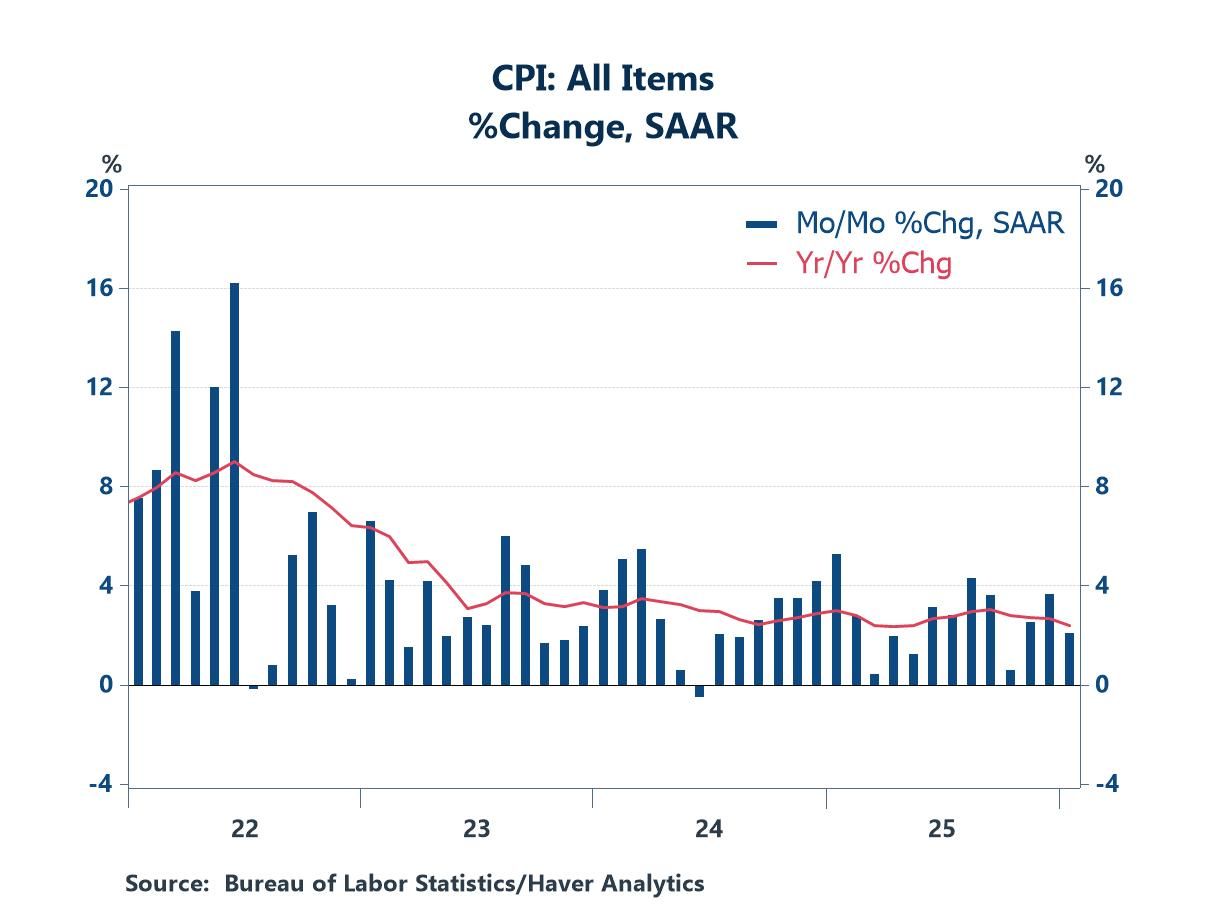
- The year-over-year change in the headline index moved to the bottom of its recent range.
- The annual change in the core index moved to a new low for the current cycle.
- of2726Go to 31 page