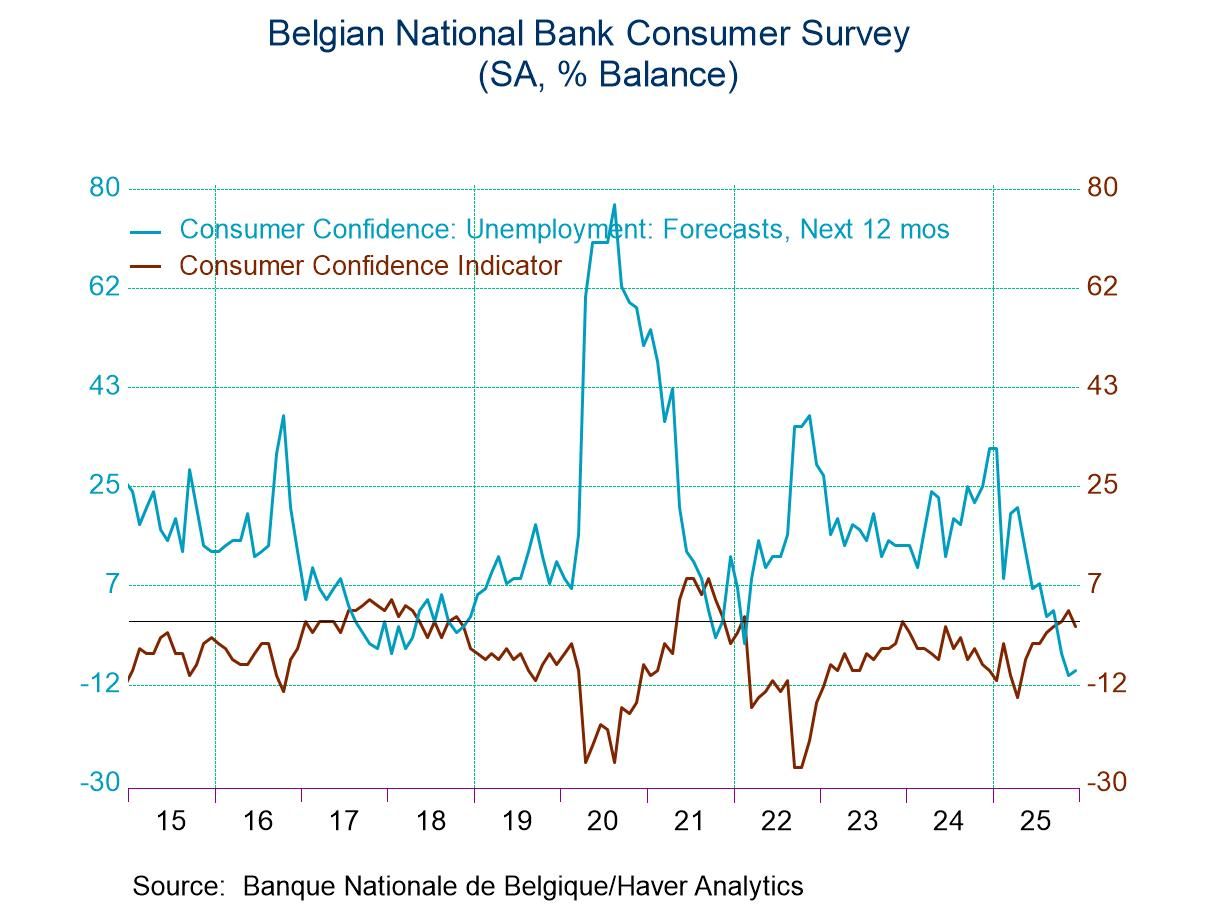
Belgian consumer confidence has been on the rise since early this year, however, in December the index has taken a step backwards with a reading of -1 compared to a November reading of +2 and then an October reading of zero. The confidence indicator, on data back to 1991 has a ranking in its 78.5 percentile, marking it as a reasonably strong reading on confidence compared to its values over that period. On the whole the trend is still solid, the month’s step-back is small.
The Economic Situation Economic situation for the next 12 months is weaker in December on a reading of -28 compared to -26 in November. The assessment of the previous 12-months is weaker in December at -42 compared to a reading of -38 in November. The outlook is weaker and the recent legacy is assessed as being slightly weaker as well, than it was in November. The assessment of the economic situation for the next 12 months is weak at a 9.7 percentile standing and the assessment of the previous 12 months is also weak at a 23.4 percentile standing.
Price Trends Price trends are seen as higher over the next 12-months at a reading of 38 compared to 27 in November. The backward-looking assessment of price trends also has them stronger in December than in November at a reading of 58 compared to 56 in November. Both of these price trend assessments are high with the outlook reading at its 94th percentile and the backward-looking assessment in its 81st percentile. Price expectations hit their low mid 2023-late 2023 and have been on the rise steadily ever since. The price metric of ‘12-months ahead’ was at zero in April of 2024 but climbed to +19 by February 2025 and currently sits at a level of 38. Price expectations are well in gear to the upside in Belgium despite relative price stability in the Euro-Area.
Unemployment Concerns about unemployment elevated slightly in December to -9 from -10 in November but these are significant readings compared to, say, the 12-month-ago reading which is at a level of +32. The sense of backtracking here is extremely weak. The sense of progress on the part of survey respondents becoming more confident about the future is clearly the prevalent feature here. The December reading for unemployment in fact has only a 2.5 percentile standing, indicating extremely weak concerns about the prospects of unemployment ahead despite the minor month-to-month step-back.
Major Household purchase environment The environment for making major household purchases deteriorates slightly in December at -15 compared to -13 in November. This only puts the index back to where it was in October. The response to the question, ‘is it favorable to buy at present’ is unchanged from its November value at -19 and it has been stuck there for three months in a row. The outlook to make major household purchases in the next 12-months logs a weaker reading at -15 than its 12-month value of -13but is stronger than its 12-month level of -18. The reading for the ‘favorable to buy at present’ question, however, is weaker at a -19 compared to -14, logged 12-months ago. The environment for making a household purchase over the next 12-months has a 55.6 percentile ranking which is above its median, however, the assessment of ‘favorable to buy at present’ has only a 20th percentile standing significantly below its median reading (median readings occur at a ranking of 50%)..
The Financial situation The financial situation for the next 12-months is assessed weaker at -3 in December, compared to zero in November; it compares to a - 2 in October. The assessment 12-months ago was also -2 so this is a very minor deterioration comparing the financial situation of households with the last 12-months produces another deterioration at -8 in December compared to -6 in November and that compares to 12-months ago at -5 another deterioration. However, the backward-looking assessment has a 52-percentile standing which is above its median while the outlook reading of -3 has a 23-percentile standing which puts it in the lower quarter of all expectations on data back to 1991. The current situation is appraised at 20 a step-back from November and October levels as well as from 12-months ago. But the current appraisal also has a queue standing in its 65.7 percentile which has a comfortable margin above its median reading. Households clearly have concerns about their financial situation even though their outlook for making household purchases is above median and their concerns about unemployment are low. Currently, conditions appear to be construed as solid.
Savings Household savings over the next 12-months are weaker in December at a reading of 20 compared to 26 in November; they are closer to their 12-month ago reading of 21. December is still a relatively high reading, in any event, with a 91-percentile standing. The question, ‘is it favorable to save at present’ is unchanged in November compared to December at a reading of -28 although it is weaker than it was 12-months ago and the percentile standing at its 78th percentile, again, a firm reading for this metric.
Summing up - assessment The consumer confidence reading from the Belgian National Bank this month shows a slight set back month-to-month, however, there is a significant an improvement that has been underway that is quite clear from the chart. The concerns that consumers have seemed to be about their financial situation haven't translated into concerns about unemployment or their willingness to make major household purchases, with unemployment concerns very low and their willingness to make household purchases for the period ahead at essentially normal levels. Still, there is more concern about inflation that is percolating, which is interesting considering that overall inflation has been relatively stable and muted in the European monetary area.
 Global