 Global
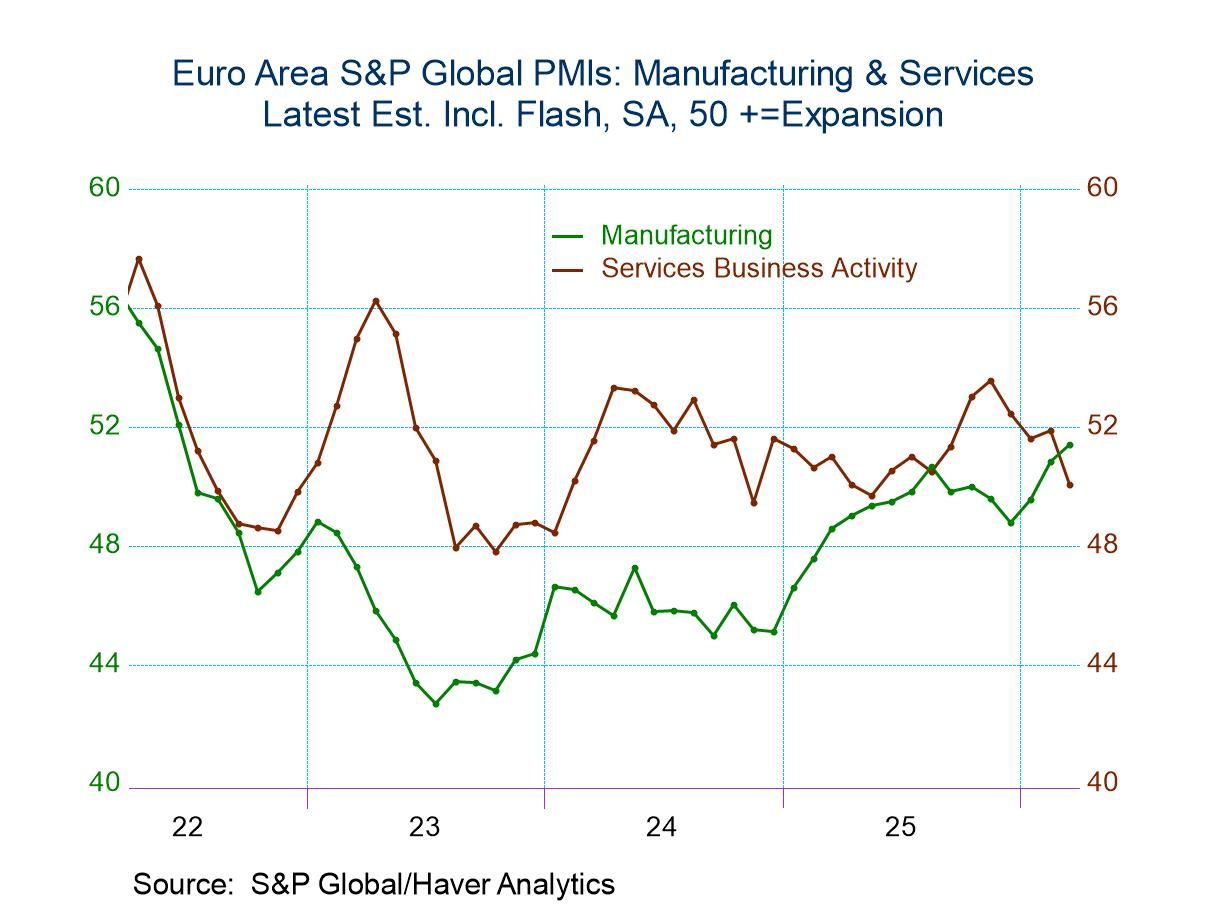
A Broad Weakening The Standard and Poor’s global PMI data show broad weakness in March compared to February. The early ‘flash’ report provides sector details for seven countries plus the consolidated European Monetary Union reading. For each reporting unit, there are readings for the composite, the manufacturing sector, and services. In March, there was a weakening on a month-to-month basis for every reporter in all sectors except manufacturing. The four manufacturing exceptions were the United States, France, Germany, and the monetary union as a whole. That means India, Australia, Japan, and the United Kingdom recorded weakening in their composite, manufacturing, and services readings in March. Meanwhile, the monetary union, Germany, France, and the U.S. that posted stronger readings in manufacturing were still dominated by weaker readings in services, causing their composites to weaken month-to-month without exception.
A Sudden Weakening These results compare to February when 13 of 24 reporters recorded stronger sector or composite readings month-to-month. In February, the monetary union and Germany reported stronger readings in all three measures—the composite, manufacturing, and services; Japan did the same. January had a much stronger month overall, with increases in most sectors across most reporting units with a few exceptions. France reported weaker services and a weaker composite, the monetary union reported weaker services and a weaker composite, and Germany reported only a weaker services sector. The remaining five reporters recorded stronger readings in all three sectors. The war in Iran has clearly interrupted what had appeared to be a strengthening, though still uneven, economic recovery.
Sequentially Different Patterns Sequential data (3-month, 6-month, and 12-month averages) do not include March since March data are still preliminary. Sequentially, the trends are mixed, with the monetary union and Germany showing weaker conditions over the three months compared to six months, but stronger conditions over six months compared to 12 months for all three sectors The United States also reports weaker conditions over three months compared to six months, and it reports weakening over six months compared to 12 months for services as well. As for manufacturing, although the U.S. services sector is weaker consistently including for 12 months compared to 12 months ago, the United Kingdom and France show strengthening in all three sectors over three months compared to six months and over six months compared to 12 months. Japan shows strengthening on that same basis, except that there's a weakening of services over three months compared to six months.
There is a mixed picture as far as trend is concerned and some areas have been stronger consistently, and others have progressed faster than others. But March has brought weakness across the board.
The Percentile Averages: The queue standings (or rank standings) show and average percentile standing for the composites (unweighted) at 41.7% over all data since January 2022. Manufacturing currently is relatively strong on this comparison with a 66.9 percentile standing. Services are weak with a 30.4 percentile standing.
The Diffusion Average: Based on data since January 2022, the average composite reading for this set of reporters is 51.9. The manufacturing average is 50.0, and the services average is 52.4. So, all rankings are relative to that set of data. Since 2022, France has had the lowest diffusion reading, with a composite average at 49.2—it has been consistently shrinking.
Manufacturing: Manufacturing has been weakest in German, with an average PMI reading of 46.6. However, France, the United Kingdom, Japan, and the EMU also have average manufacturing sector readings below 50, indicating ongoing manufacturing contraction.
Services and Comparisons: Only France has averaged a service sector contraction since January 2022. Over this period, India has had the strongest diffusion readings across all sectors. The U.S. has logged the second-strongest PMI readings in services, manufacturing, and the composite.
The U.S. as a benchmark and sticky conditions: For the U.S., the average has been 52.2 for the composite, 51.0 for manufacturing, and 52.4 for services. Since these are the second-strongest set of readings, it makes clear that the readings for this period have been quite tepid. Whatever recovery was in progress was probably slow and fairly fragile. Central banks had largely brought inflation down and, in some sense, ‘under control,’ but still, not to target. These sticky realities have been dogging policy-makers. It has been a difficult period. Of course, the Russia-Ukraine war dragged on, Hamas attacked Isreal, Iran’s nuclear facilities were destroyed, the Trump tariffs remained in place, and a second attack on Iran—intended to undermine its surviving nuclear ambitions—was launched with a goal to degrade its huge cache of missiles and drones as well.