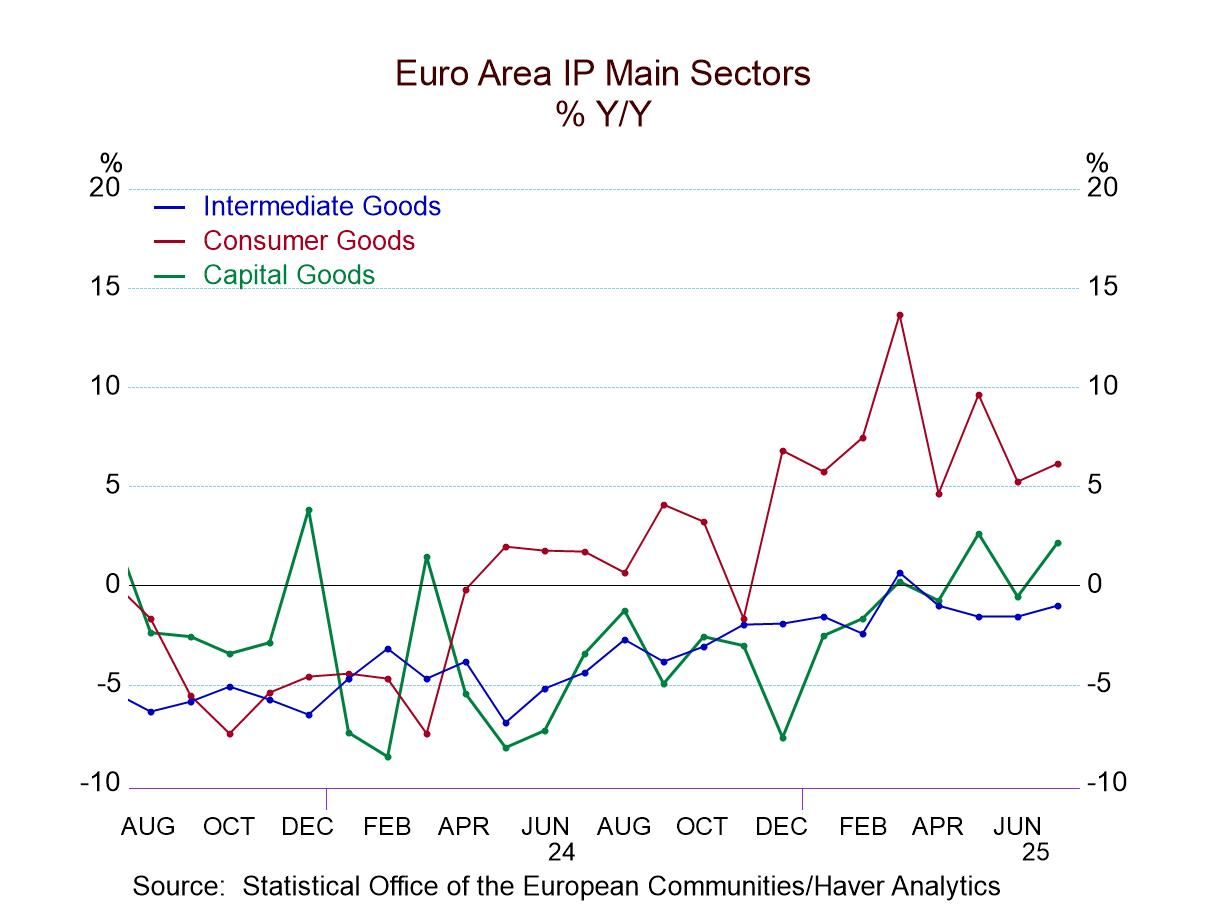
Haver Analytics
Haver Analytics

Economy in Brief

  • Japan’s confidence is still weak and in a down cycle. Since reaching a sharp peak early in 2024, confidence continues to recede. All components are showing decline on all horizons from 12-months to 6-months to 3-months. This is an extremely uniform response.

    Consumer confidence has a 15-percentile standing on data back to 2004. Components of the confidence index has standing that range from a standing at the 47.8% mark for the valuation of assets to a low at the 6.1 percentile mark for willingness to purchase durable goods.

    In keeping with this weakness, the overall livelihood standing is at its 10.2 percentile.

    • Economic & sales expectations weaken.
    • Employment plans fall but job openings rise.
    • Prices decline but price expectations rise.
    • Gasoline prices strengthen.
    • Crude oil prices fall.
    • Natural gas costs rise.
  • Japan’s Economy Watchers Index saw its current and future indexes fall and indicated contraction in March. We can only imagine the knock-on effects of impending U.S. tariffs on these perceptions and expectations in the months ahead.

    As it stands, Japan’s economy watchers survey show month-to-month attitude deterioration in their diffusion responses up and down the line. For the current conditions survey, entries erode except for eating & drinking places, manufacturers, and services. For the future index, all the responses are weaker month-to-month except for housing, corporations, and manufacturers.

    In terms of percentile standings on survey responses from March 2004 to date, only one category in the current or future services, current manufacturers, has a reading above the 50% mark making it the lone response above its historic median on this timeline. It achieves this ‘milestone’ with a diffusion reading of 47.8, that nonetheless indicates contraction. Manufacturers also have the highest diffusion ranking in the future survey but at the below median 46.2 percentile mark; the topical diffusion reading of 47.4 indicates ongoing contraction.

    • Nonrevolving credit declines slightly.
    • Revolving credit edges up.
  • This week, we focus on the sweeping "reciprocal" US tariffs announced by President Trump last week. As shown in chart 1, these tariffs are primarily based on US trade deficits with its trading partners. This is in contrast to earlier indications that suggested other factors, such as tariff and non-tariff barriers, would also be considered. Using the tariff formula provided by the US Trade Representative, we derive the announced tariff rates. We also highlight the factors contributing to Vietnam’s relatively high "reciprocal" tariff rate, compared to other Asian economies such as Singapore (chart 2). However, we argue that focusing solely on trade deficits does not fully capture the trade dynamics between the US and its partners. The applied tariff rates of other economies should also be factored in (chart 3), especially in relation to trade with the US. Moreover, non-tariff trade barriers (chart 4) should also be considered, as tariffs and trade deficits alone may not provide a complete picture of trade dynamics. To present an alternate view, we introduce a “tariff scorecard”, which incorporates these factors and offers a perspective on how US "reciprocal" tariffs could have been applied (chart 5). Looking ahead, with the "reciprocal" tariffs already in place, we also discuss the initial and varying responses from Asian economies, considering their significant exposure to these tariffs (chart 6).

    US “reciprocal” tariffs Last week, US President Trump’s announcement of “reciprocal” tariffs caught many economists by surprise. While the tariffs themselves were anticipated, their scope and scale were far more severe than expected, contradicting much of the messaging leading up to the announcement. Prior statements—both before and during the unveiling of the tariffs—suggested that the "reciprocal" measures would account for various factors, including trade barriers (both tariff and non-tariff) and currency manipulation. However, the formula revealed by the US Trade Representative’s Office showed that the tariffs were simply based on the US trade deficit with other countries, as outlined in chart 1. This approach was far simpler than expected, relying solely on trade deficits without factoring in the other economic considerations. Also, many investors and observers were shocked by the announcement, as it contradicted earlier messaging that the tariffs would be “lenient.” Some had also expected bilateral negotiations with trading partners to influence the final tariff structure. Instead, the formula was purely based on the US trade deficit. Furthermore, even countries with low or no tariffs on US imports—or those with which the US runs a trade surplus (such as Singapore)—were still subjected to a 10% tariff floor.

    • Job strength is concentrated in three sectors.
    • Earnings growth trend decelerates.
    • Jobless rate is highest in four months.
  • Germany
    | Apr 04 2025

    German Orders Fall

    German orders came up flat in February after falling by 5.5% in January. It's been a turbulent period for orders. The January drop came after an increase of 5.6% in December, so orders have been chopping around the last few months and are not really going anywhere. Foreign orders rose 0.8% in February after falling 0.5% in January and being flat in December. Domestic orders fell 1.2% in February after falling by 12.1% in January but that had followed a 13.9% increase in December. Once again, there is a lot of volatility and little trend.

    The trend path for orders looking at 12-month, 6-month, and 3-month growth shows not much stirring. Total order orders fall 0.2% over 12 months; they rise at a 2.7% annual rate over six months and then fall at a 0.9% annual rate over three months.

    Foreign orders rose 0.1% over 12 months; they were up 1.9% at an annual rate over six months and they rose by 1.4% at an annual rate over three months. Foreign orders are showing some sustainable growth over three months and six months although they have very little to show for it over 12 months. Domestic orders fall by 0.9% over 12 months; they gain at a 3.5% annual rate over six months and then fall at a 4.3% annually over three months. Domestic orders display the same kind of volatility that we see in the headline overall and not the tendency toward creeping growth that we see looking at foreign orders. Moreover, the domestic series updates with a 3-month growth rate that's negative which is not encouraging. Real sales data show a small increase in February of 0.2% for manufacturing after falling 1.0% in January and rising 0.8% in December. The sequential growth rates hint at some improvement but not much with a 3% decline over 12 months, a 0.4% decline at an annual rate over six months and then a swing to positive growth at 0.4% at an annual rate over three months; this is creeping and good news, but it's very moderate growth.

    Industrial confidence measures for Germany, France, Italy, and Spain the four largest economies in the European Monetary Union, show a modest improvement from January to February in Germany and in France, unchanged conditions in Italy, compared to some slight slippage in Spain. Viewed sequentially, the industrial confidence data don't show much movement from 12-months to 6-months to 3-months for these countries; Germany and France get slightly weaker; Italy and Spain have even smaller moves although they also get slightly weaker. The rankings on the levels of these industrial confidence measures in February give us rankings that are below the 50% mark, putting them below their median for all four countries. The reading for Germany is the lowest with 5.9 percentile standings; the others have rankings between the 20th and 40th percentile on that timeline.

    The data on orders in real sales on a ranking basis we find overall orders and domestic orders are moderate-to-weak with an overall order of ranking in the 53rd percentile compared to a domestic ranking at the 25th percentile and foreign orders have a firm 71.5 percentile standing. These calculations are based on the levels of orders. Then expressed in terms of growth rates, these three orders metrics have rankings between their 36th and 40th percentiles putting them below their median growth rate for the period. Real sector sales, for manufacturing sales for example with a 48-percentile standing based upon the level of sales, logs a 19-percentile standing based upon the ranking of its year-over-year growth rate.